 4
4peptides
spectra

0.000 | 0.000
0.184 | 0.296
0.662 | 0.788
0.000 | 0.060
0.000 | 0.000
0.000 | 0.000
0.000 | 0.000
0.000 | 0.000
| Plot | Mito | Lyso | Perox | ER | Golgi | PM | Cytosol | Nucleus | |||||
| Expt A |
4 peptides |
8 spectra |
|
0.000 0.000 | 0.000 |
0.243 0.184 | 0.296 |
0.738 0.662 | 0.788 |
0.019 0.000 | 0.060 |
0.000 0.000 | 0.000 |
0.000 0.000 | 0.000 |
0.000 0.000 | 0.000 |
0.000 0.000 | 0.000 |
| 1 spectrum, LLVVSAQLSHCR | 0.177 | 0.156 | 0.473 | 0.006 | 0.000 | 0.188 | 0.000 | 0.000 | ||
| 2 spectra, SLWTMLK | 0.000 | 0.392 | 0.608 | 0.000 | 0.000 | 0.000 | 0.000 | 0.000 | ||
| 2 spectra, VLQVDSAR | 0.000 | 0.268 | 0.732 | 0.000 | 0.000 | 0.000 | 0.000 | 0.000 | ||
| 3 spectra, LFDDLAMFVYTK | 0.000 | 0.130 | 0.754 | 0.116 | 0.000 | 0.000 | 0.000 | 0.000 |
| Plot | Mito | Lyso or Perox | ER | Golgi | PM | Cytosol | Nucleus | ||||||
| Expt B |
3 peptides |
11 spectra |
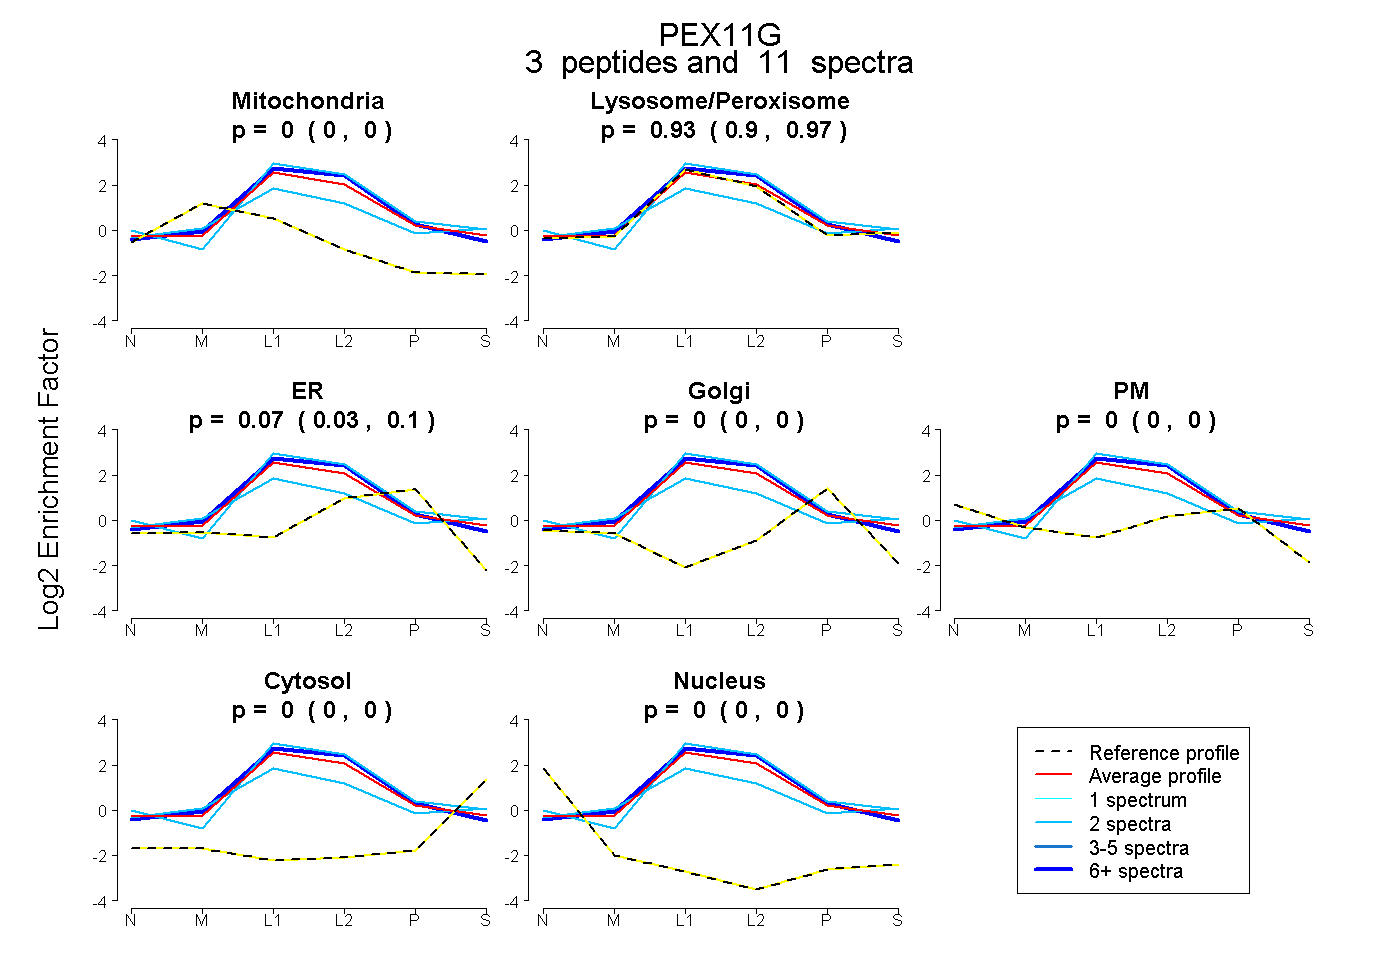 |
0.000 0.000 | 0.000 |
0.933 0.897 | 0.965 |
0.067 0.027 | 0.098 |
0.000 0.000 | 0.000 |
0.000 0.000 | 0.000 |
0.000 0.000 | 0.000 |
0.000 0.000 | 0.000 |
|||
| Plot | Lyso | Other | |||||||||||
| Expt C |
5 peptides |
24 spectra |
 |
0.000 0.000 | 0.000 |
1.000 1.000 | 1.000 |
||||||||
| Plot | Lyso | Other | |||||||||||
| Expt D |
2 peptides |
4 spectra |
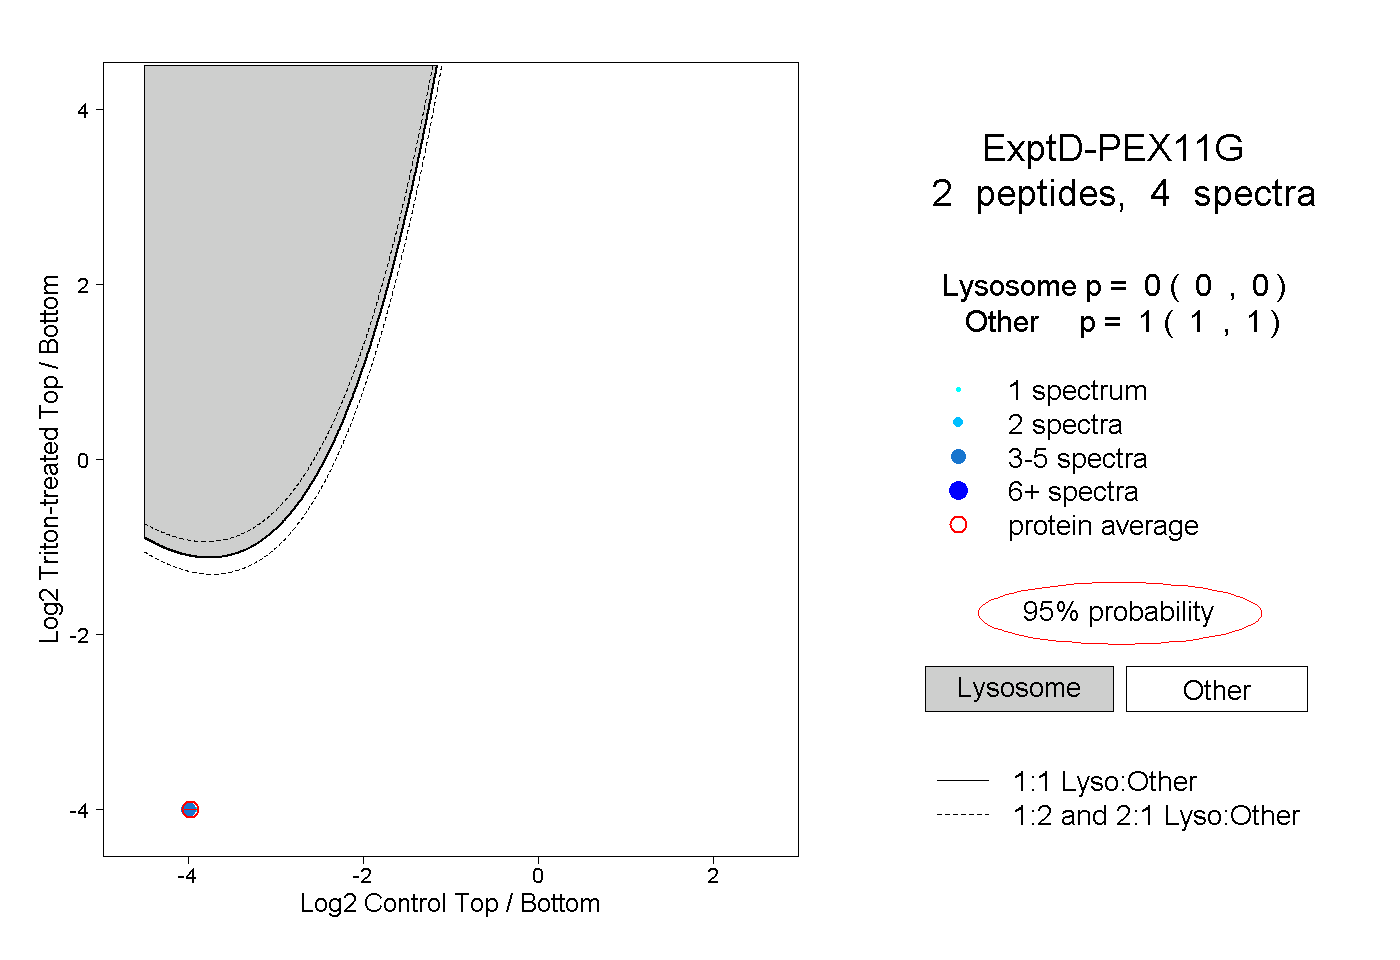 |
0.000 0.000 | 0.000 |
1.000 1.000 | 1.000 |