 6
6peptides
spectra

0.007 | 0.014
0.000 | 0.000
0.000 | 0.000
0.921 | 0.926
0.000 | 0.000
0.000 | 0.000
0.000 | 0.000
0.063 | 0.068
4peptides
spectra
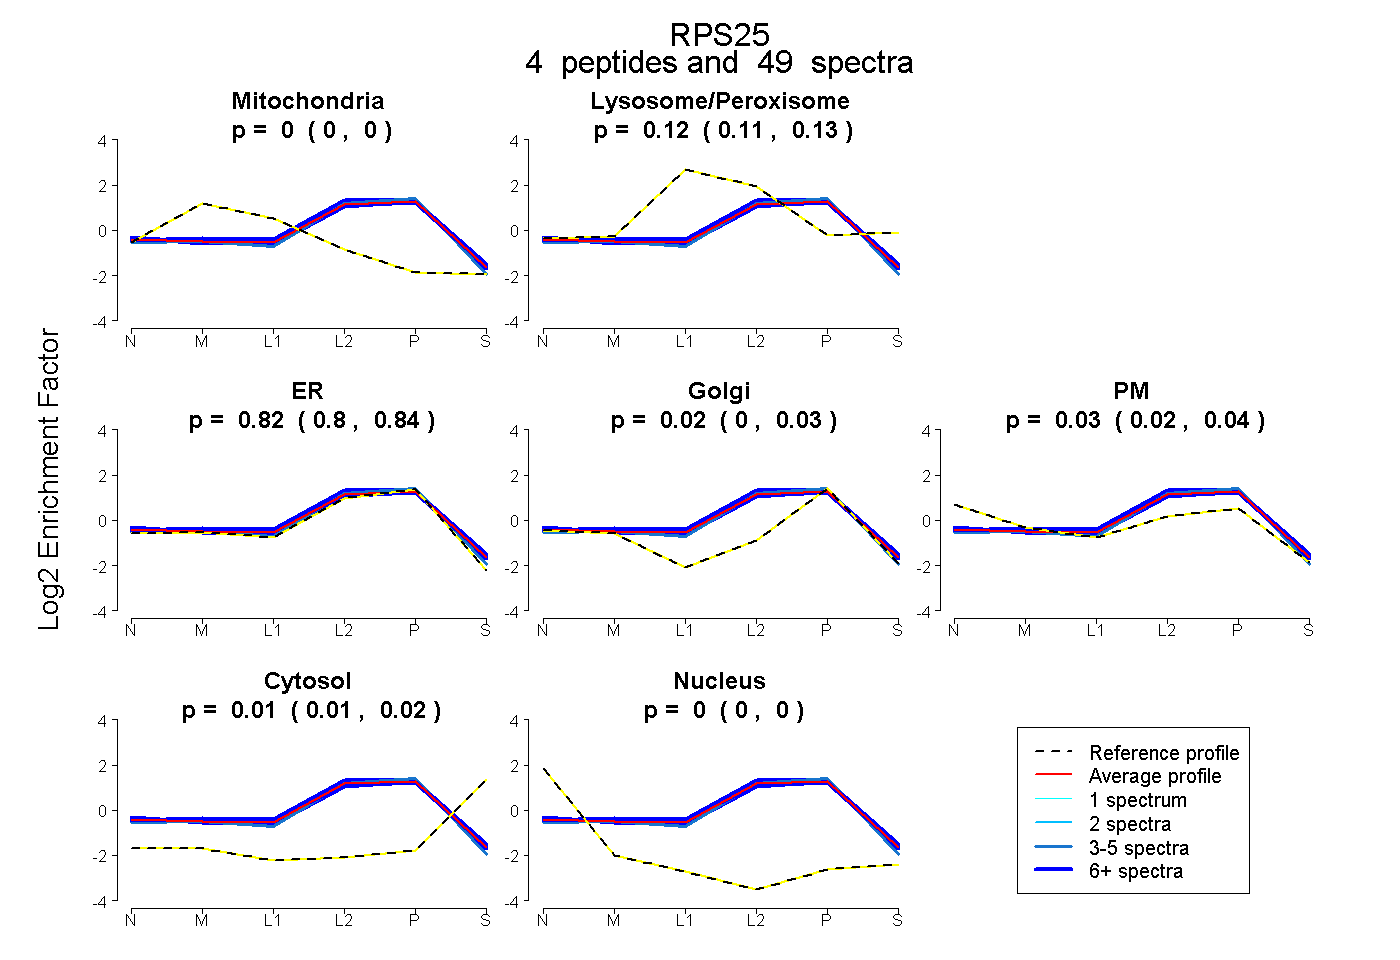
0.000 | 0.000
0.112 | 0.129
0.803 | 0.838
0.000 | 0.033
0.017 | 0.037
0.007 | 0.016
0.000 | 0.000
5peptides
spectra
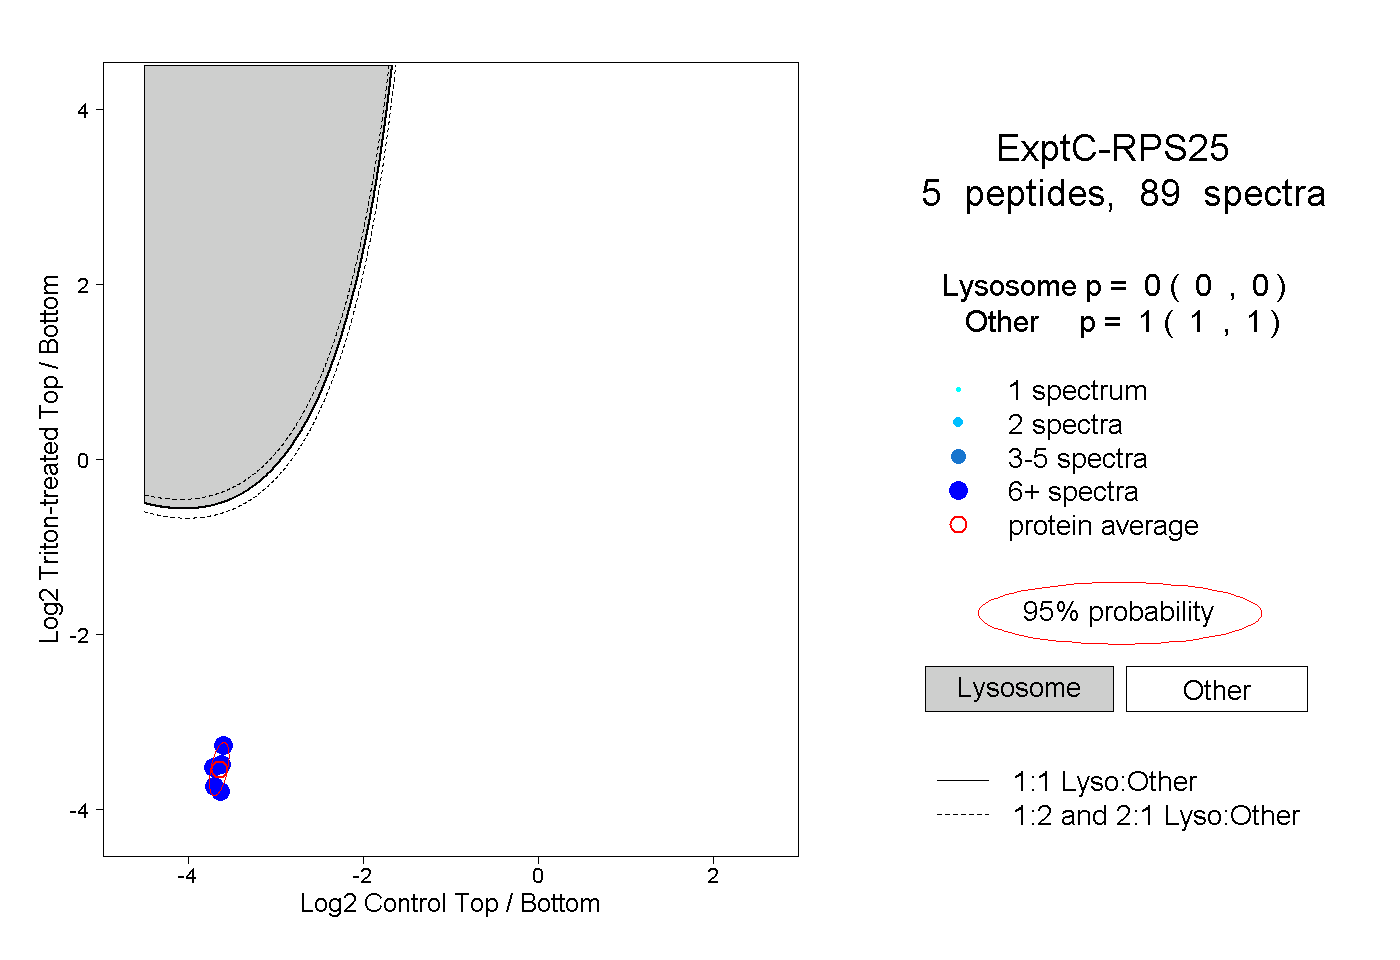
0.000 | 0.000
1.000 | 1.000
4peptides
spectra

0.000 | 0.000
1.000 | 1.000