RPS25
[ENSRNOP00000033144]
Main page
| | | Plot |
Mito |
Lyso |
|
Perox |
ER |
Golgi |
PM |
Cytosol |
Nucleus |
|
| Expt A |
 6
6
peptides |
77
spectra |
 |
0.011
0.007 | 0.014 |
0.000
0.000 | 0.000 |
|
0.000
0.000 | 0.000 |
0.924
0.921 | 0.926 |
0.000
0.000 | 0.000 |
0.000
0.000 | 0.000 |
0.000
0.000 | 0.000 |
0.065
0.063 | 0.068 |
|
| | | Plot |
Mito |
|
Lyso or Perox |
|
ER |
Golgi |
PM |
Cytosol |
Nucleus |
|
| Expt B |
4
peptides |
49
spectra |
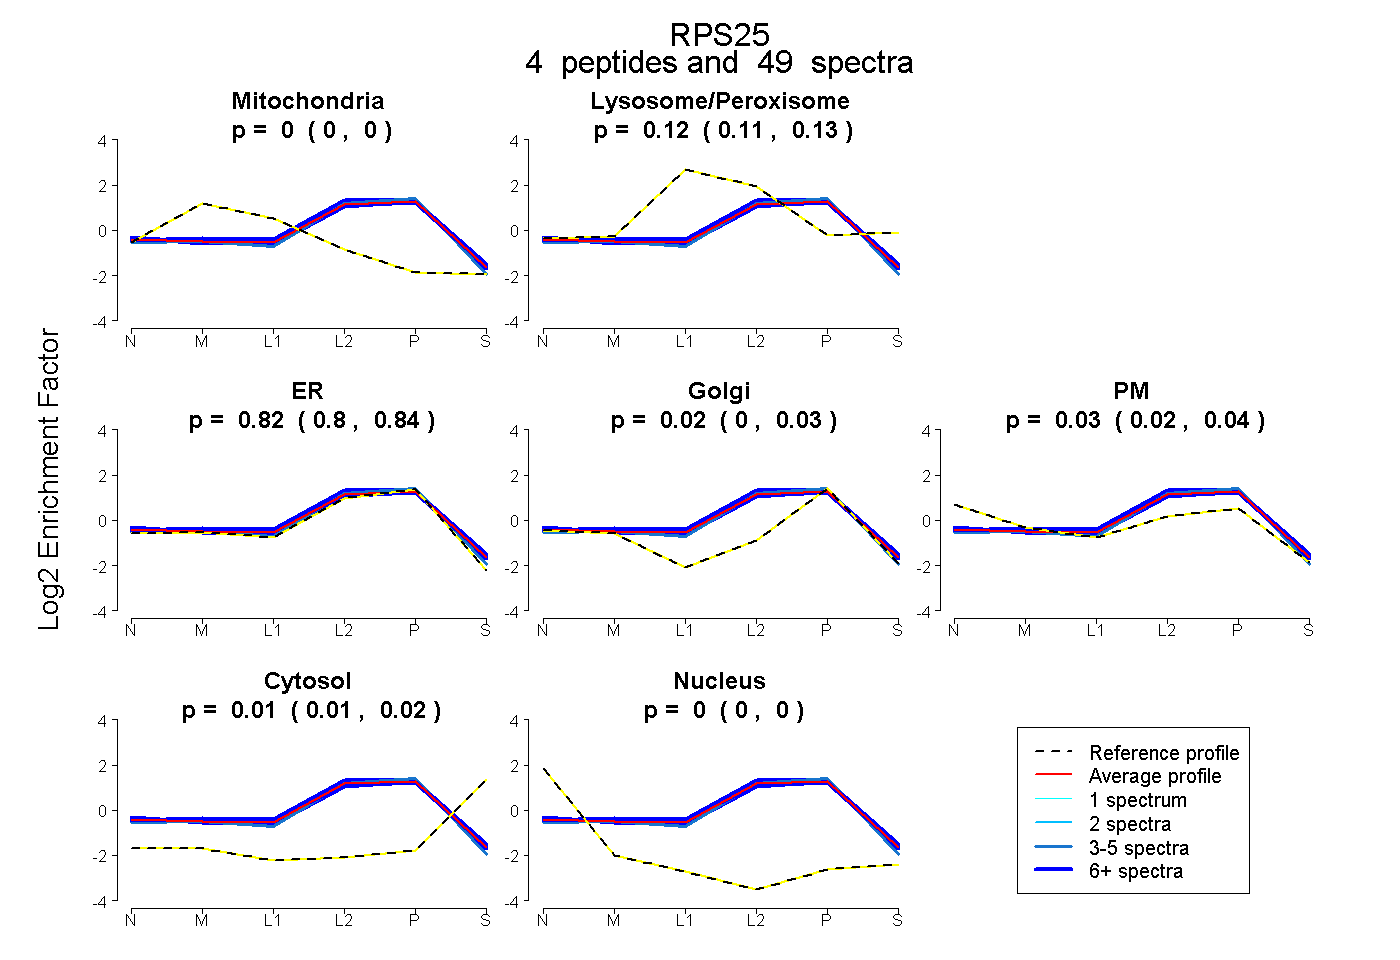 |
0.000
0.000 | 0.000 |
|
0.121
0.112 | 0.129 |
|
0.823
0.803 | 0.838 |
0.016
0.000 | 0.033 |
0.028
0.017 | 0.037 |
0.012
0.007 | 0.016 |
0.000
0.000 | 0.000 |
|
| 5 spectra, GGDAPAAGEDA |
0.000 |
|
0.044 |
|
0.956 |
0.000 |
0.000 |
0.000 |
0.000 |
|
| 9 spectra, AALQELLSK |
0.000 |
|
0.138 |
|
0.853 |
0.000 |
0.010 |
0.000 |
0.000 |
|
| 20 spectra, AQVIYTR |
0.000 |
|
0.116 |
|
0.748 |
0.046 |
0.069 |
0.021 |
0.000 |
|
| 15 spectra, LITPAVVSER |
0.000 |
|
0.171 |
|
0.733 |
0.096 |
0.000 |
0.000 |
0.000 |
|
| | | Plot |
|
Lyso |
|
|
|
|
|
|
|
Other |
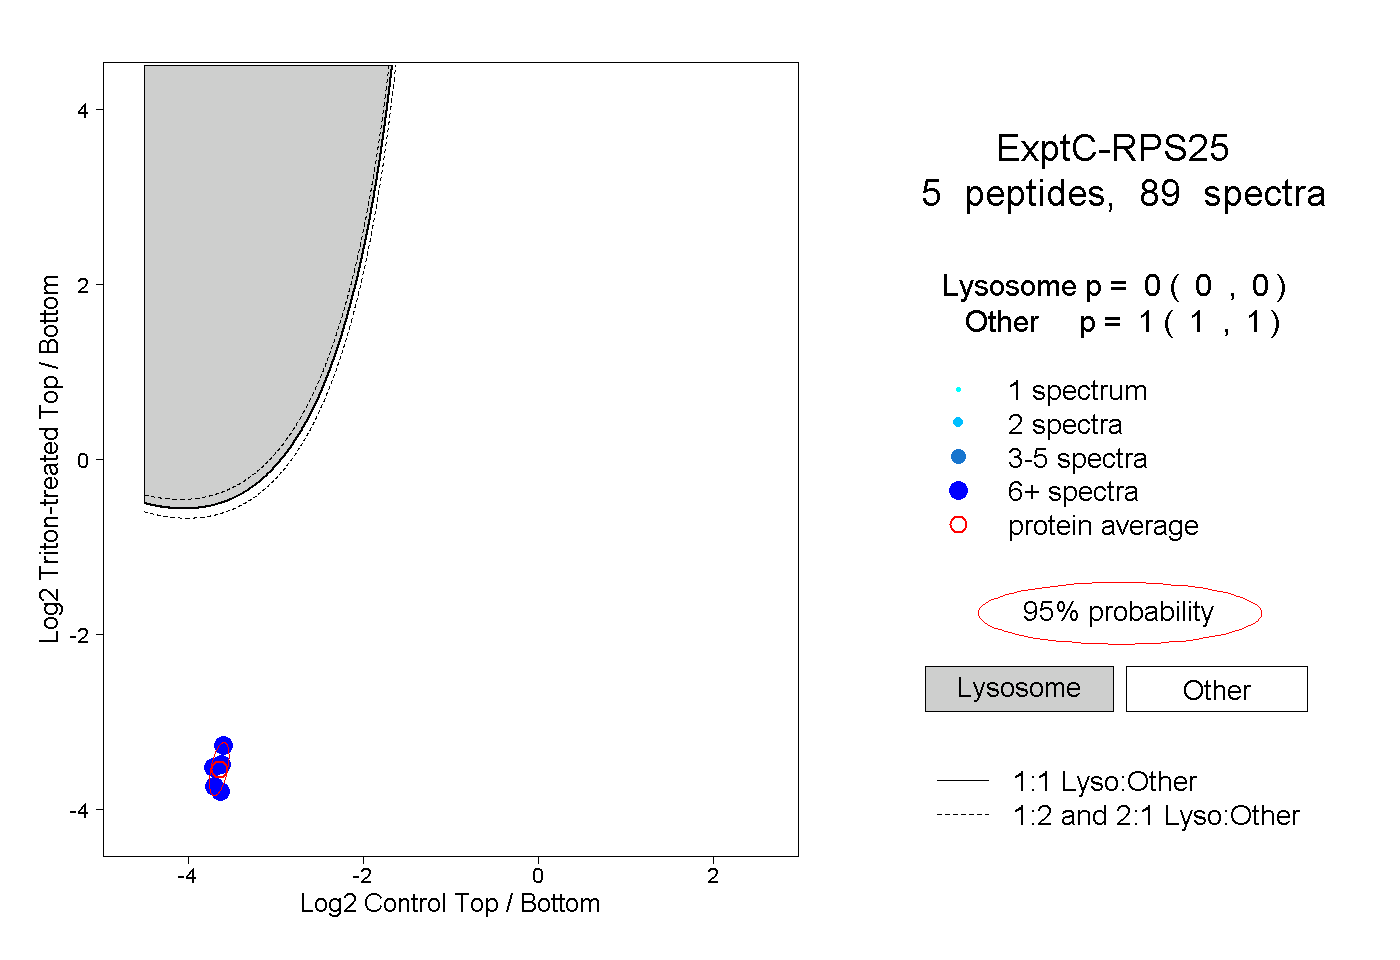
| Expt C |
5
peptides |
89
spectra |
 |
|
0.000
0.000 | 0.000 |
|
|
|
|
|
|
|
1.000
1.000 | 1.000 |
| | | Plot |
|
Lyso |
|
|
|
|
|
|
|
Other |
| Expt D |
4
peptides |
7
spectra |
 |
|
0.000
0.000 | 0.000 |
|
|
|
|
|
|
|
1.000
1.000 | 1.000 |