 6
6peptides
spectra
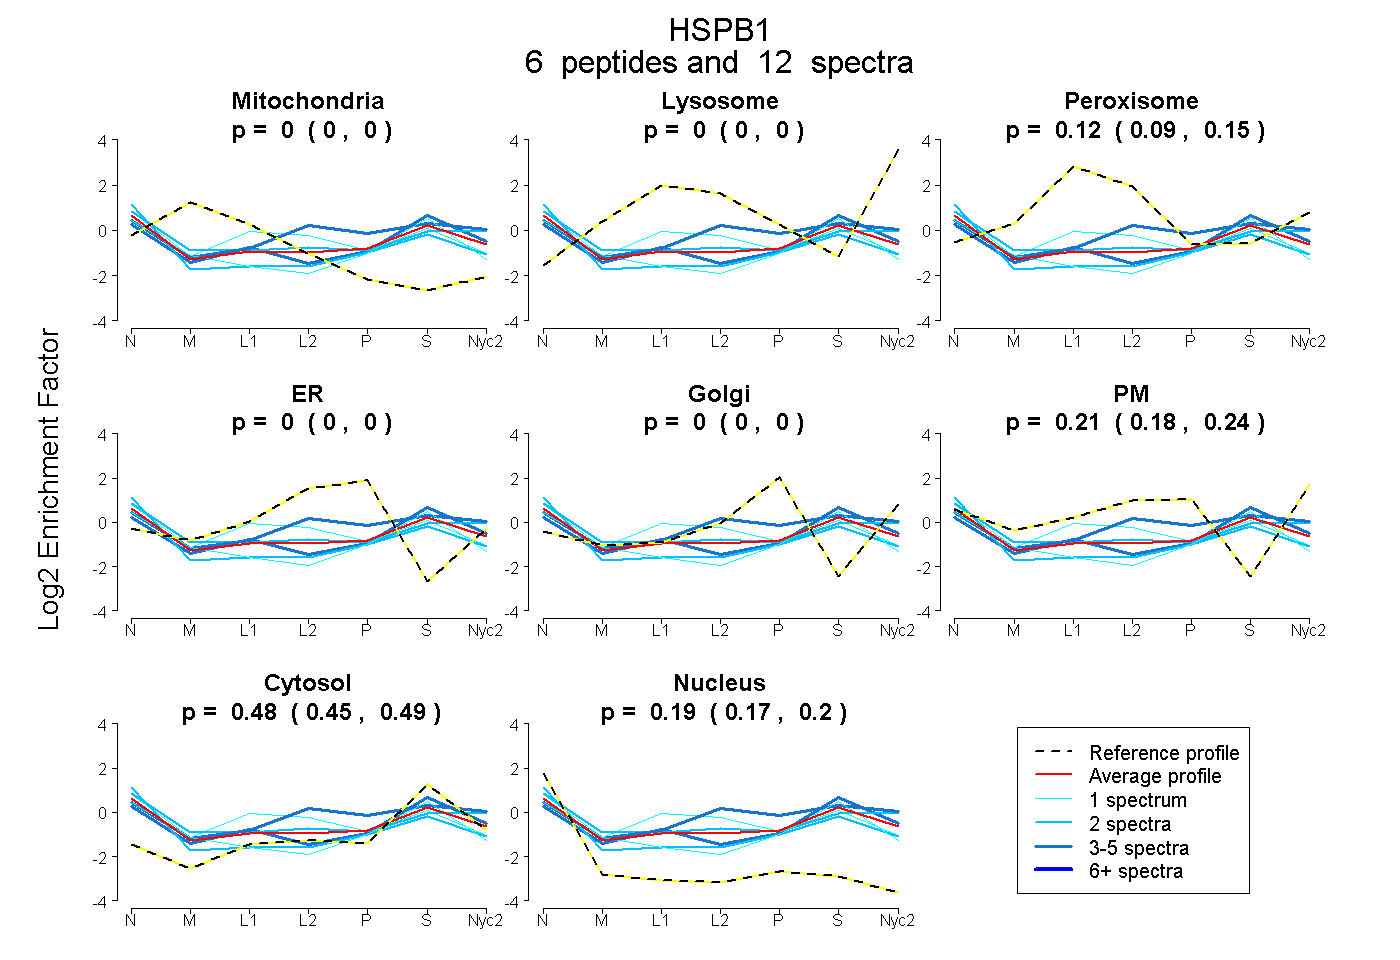
0.000 | 0.000
0.000 | 0.000
0.090 | 0.153
0.000 | 0.000
0.000 | 0.000
0.183 | 0.239
0.452 | 0.494
0.169 | 0.202
1peptide
spectrum
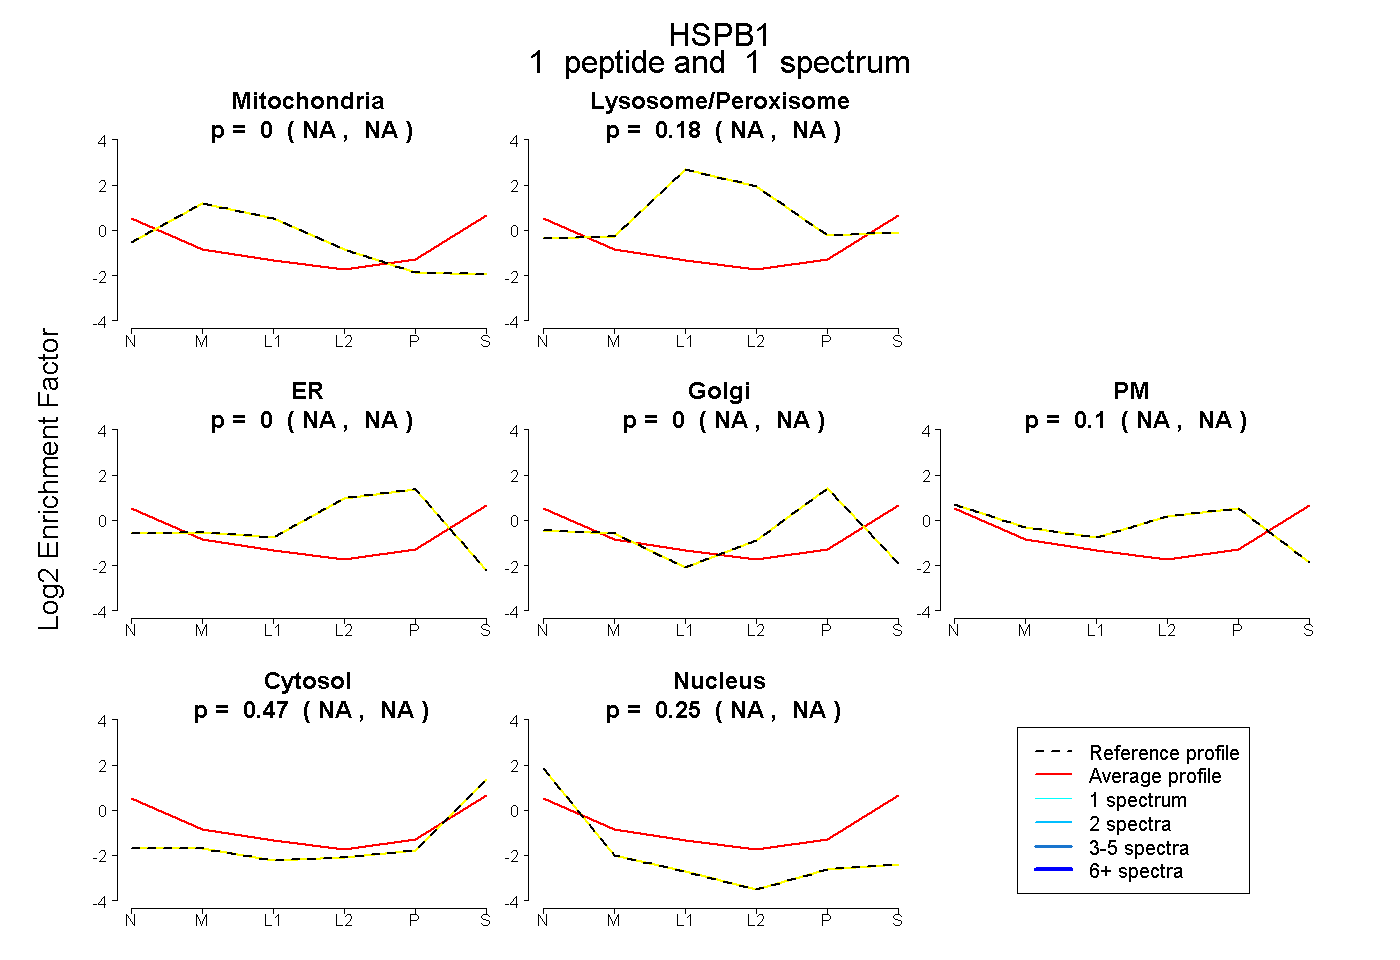
NA | NA
NA | NA
NA | NA
NA | NA
NA | NA
NA | NA
NA | NA
4peptides
spectra
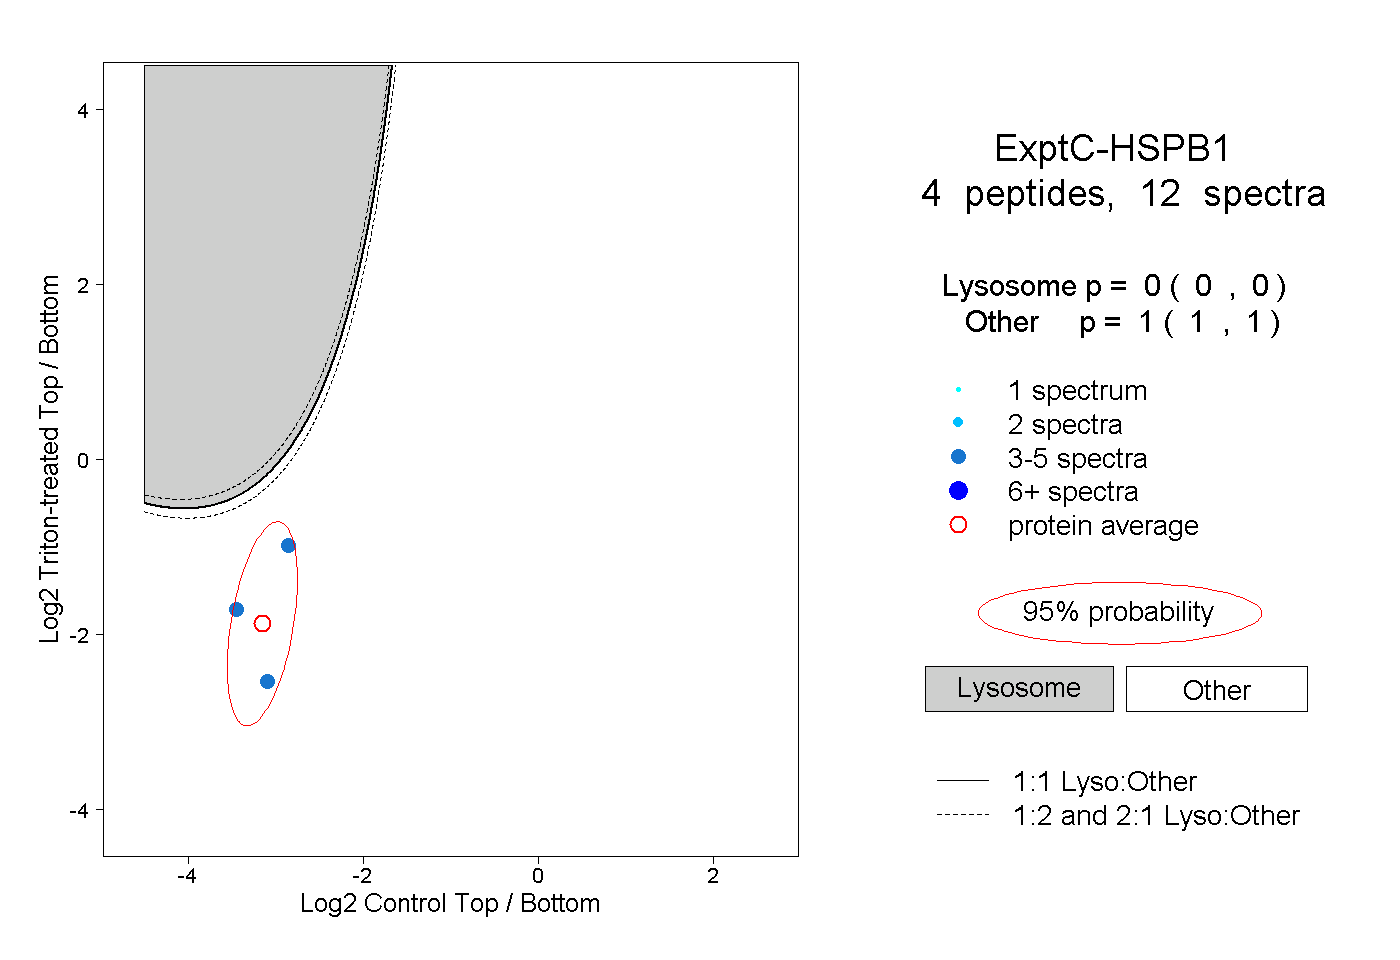
0.000 | 0.000
1.000 | 1.000