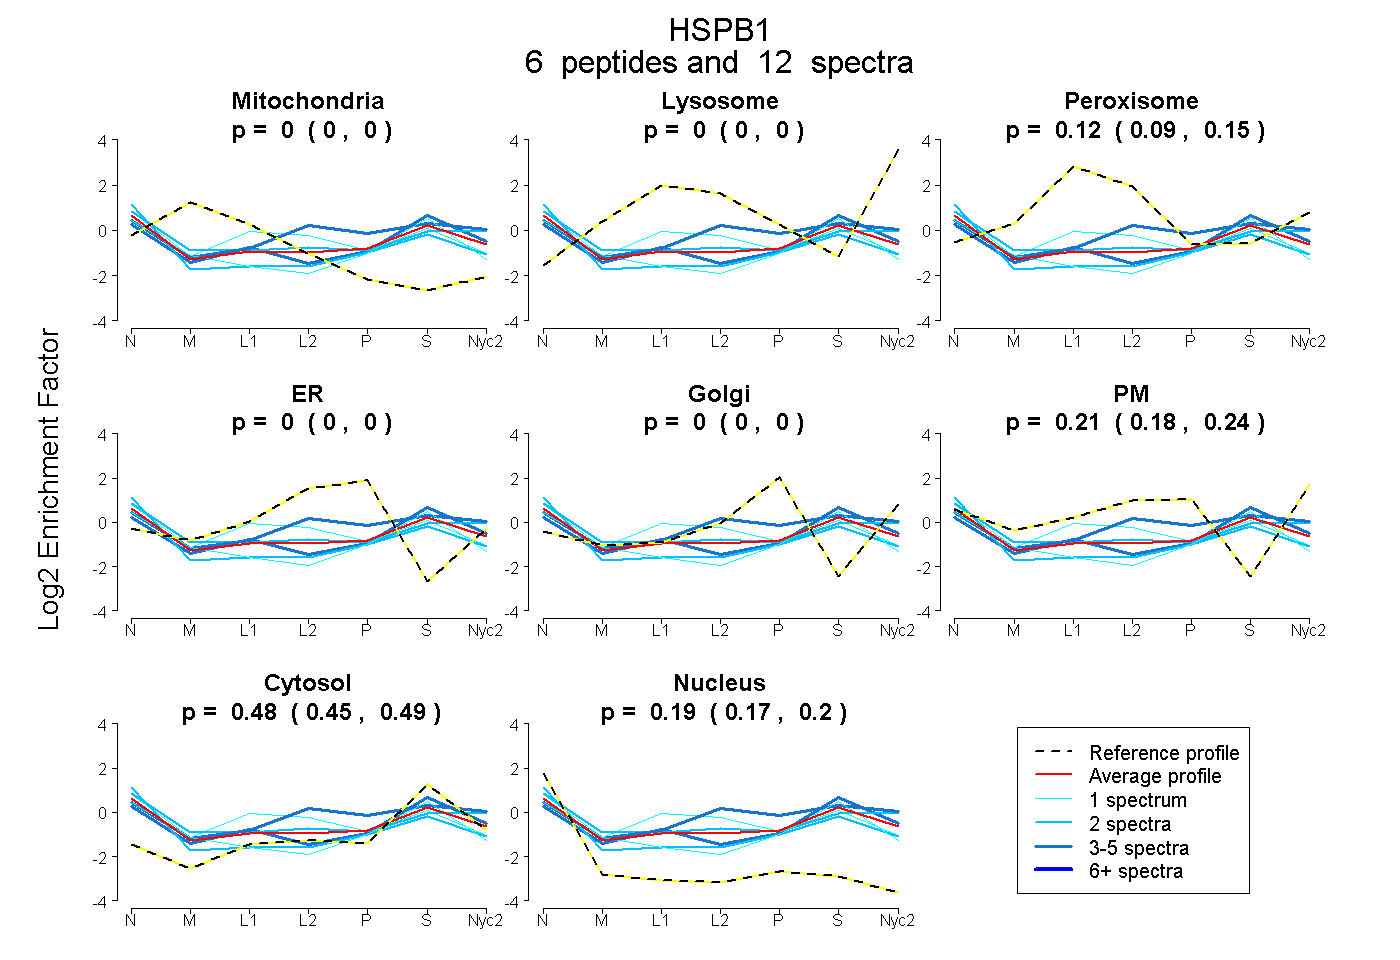
 6
6peptides
spectra
0.000 | 0.000
0.000 | 0.000
0.090 | 0.153
0.000 | 0.000
0.000 | 0.000
0.183 | 0.239
0.452 | 0.494
0.169 | 0.202
| Plot | Mito | Lyso | Perox | ER | Golgi | PM | Cytosol | Nucleus | |||||
| Expt A |
6 peptides |
12 spectra |
|
0.000 0.000 | 0.000 |
0.000 0.000 | 0.000 |
0.122 0.090 | 0.153 |
0.000 0.000 | 0.000 |
0.000 0.000 | 0.000 |
0.215 0.183 | 0.239 |
0.476 0.452 | 0.494 |
0.187 0.169 | 0.202 |
| 1 spectrum, SPSWEPFR | 0.122 | 0.000 | 0.000 | 0.000 | 0.000 | 0.093 | 0.597 | 0.188 | ||
| 2 spectra, LFDQAFGVPR | 0.009 | 0.000 | 0.113 | 0.000 | 0.000 | 0.312 | 0.404 | 0.162 | ||
| 3 spectra, EGVVEITGK | 0.004 | 0.000 | 0.124 | 0.000 | 0.000 | 0.131 | 0.608 | 0.134 | ||
| 3 spectra, QDEHGYISR | 0.000 | 0.000 | 0.063 | 0.000 | 0.000 | 0.408 | 0.514 | 0.015 | ||
| 1 spectrum, AQIGGPESEQSGAK | 0.000 | 0.000 | 0.426 | 0.000 | 0.000 | 0.032 | 0.286 | 0.256 | ||
| 2 spectra, QLSSGVSEIR | 0.000 | 0.000 | 0.000 | 0.000 | 0.000 | 0.243 | 0.433 | 0.324 |
| Plot | Mito | Lyso or Perox | ER | Golgi | PM | Cytosol | Nucleus | ||||||
| Expt B |
1 peptide |
1 spectrum |
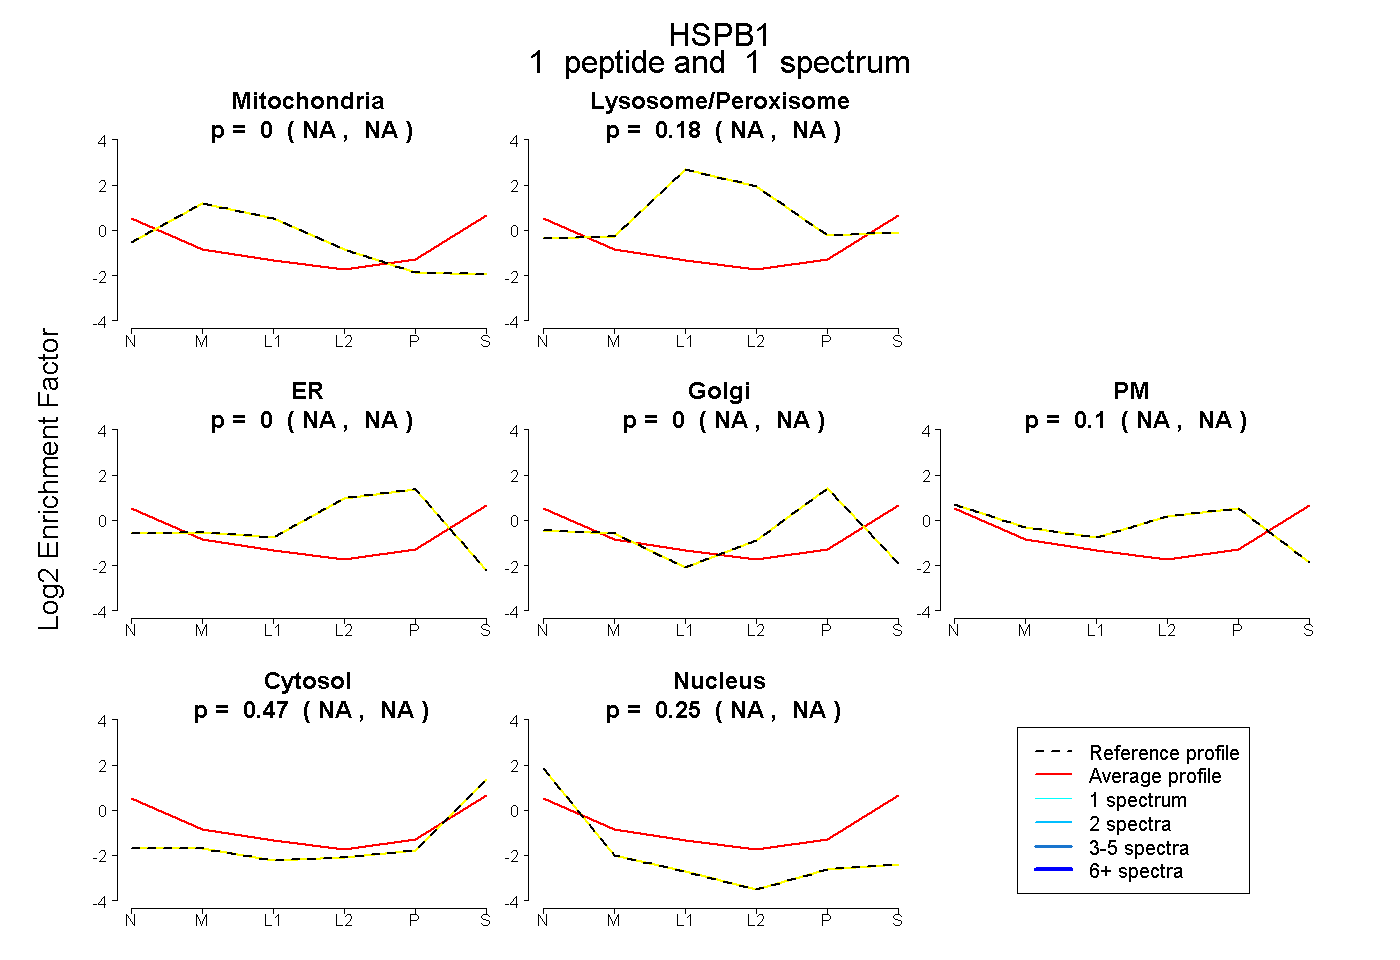 |
0.000 NA | NA |
0.179 NA | NA |
0.000 NA | NA |
0.000 NA | NA |
0.095 NA | NA |
0.473 NA | NA |
0.253 NA | NA |
|||
| Plot | Lyso | Other | |||||||||||
| Expt C |
4 peptides |
12 spectra |
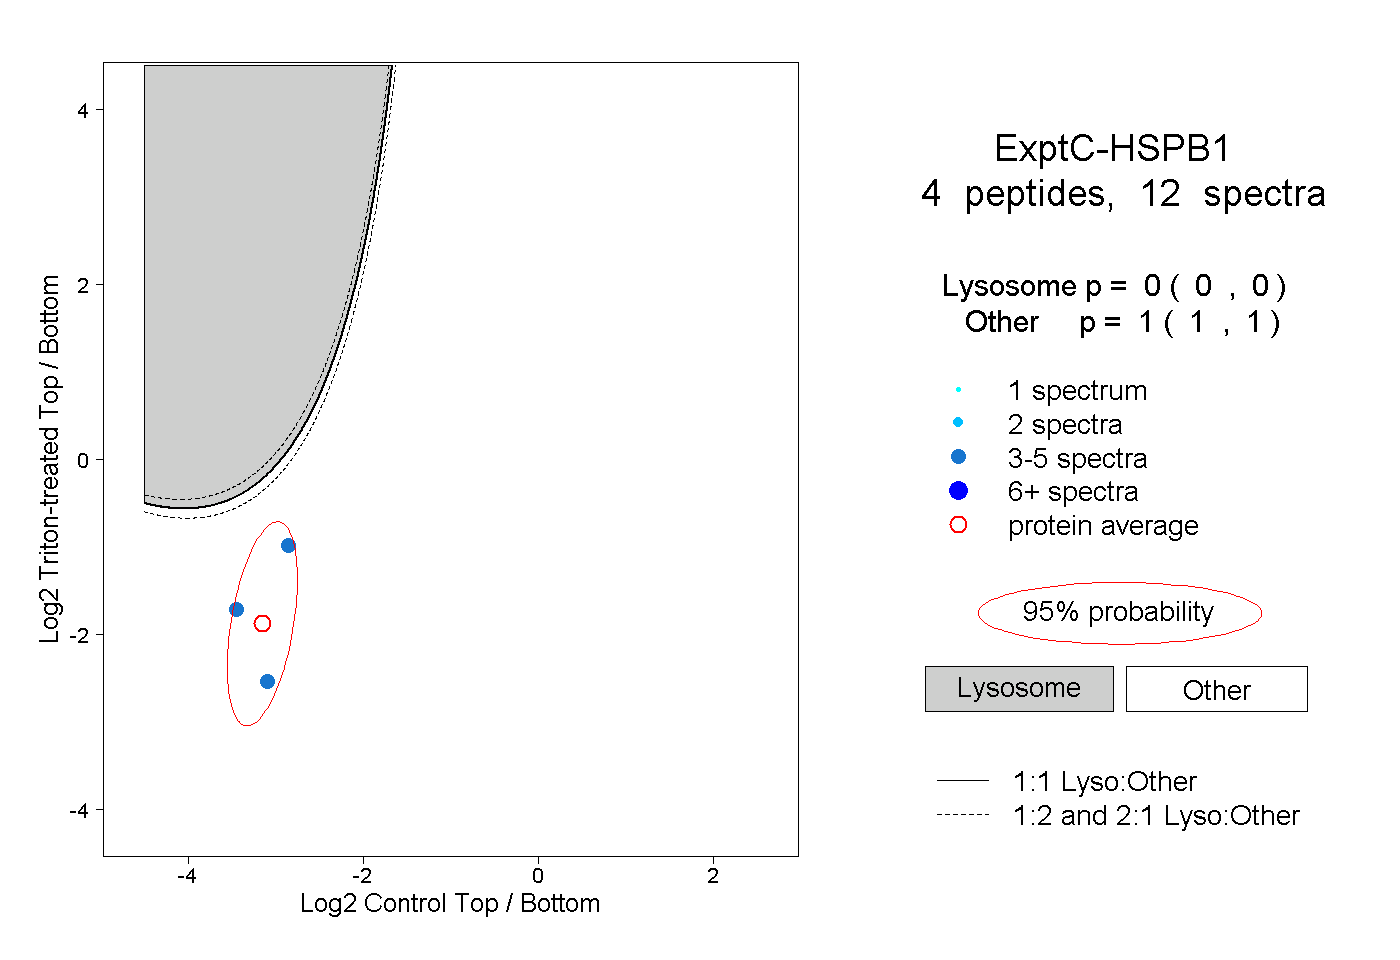 |
0.000 0.000 | 0.000 |
1.000 1.000 | 1.000 |