 12
12peptides
spectra
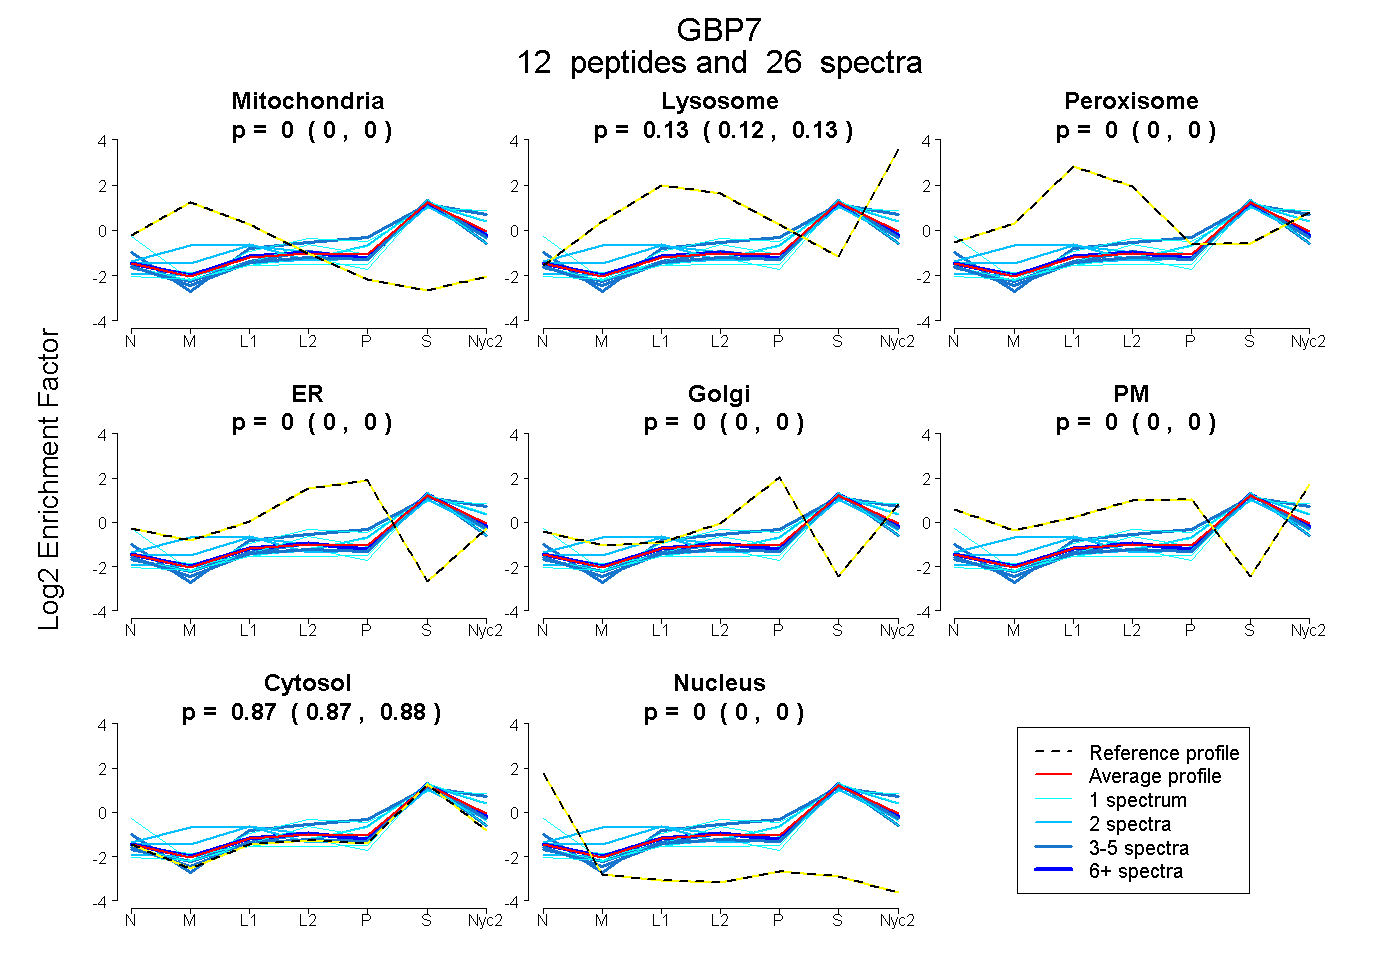
0.000 | 0.000
0.122 | 0.134
0.000 | 0.000
0.000 | 0.000
0.000 | 0.000
0.000 | 0.000
0.865 | 0.877
0.000 | 0.000
4peptides
spectra
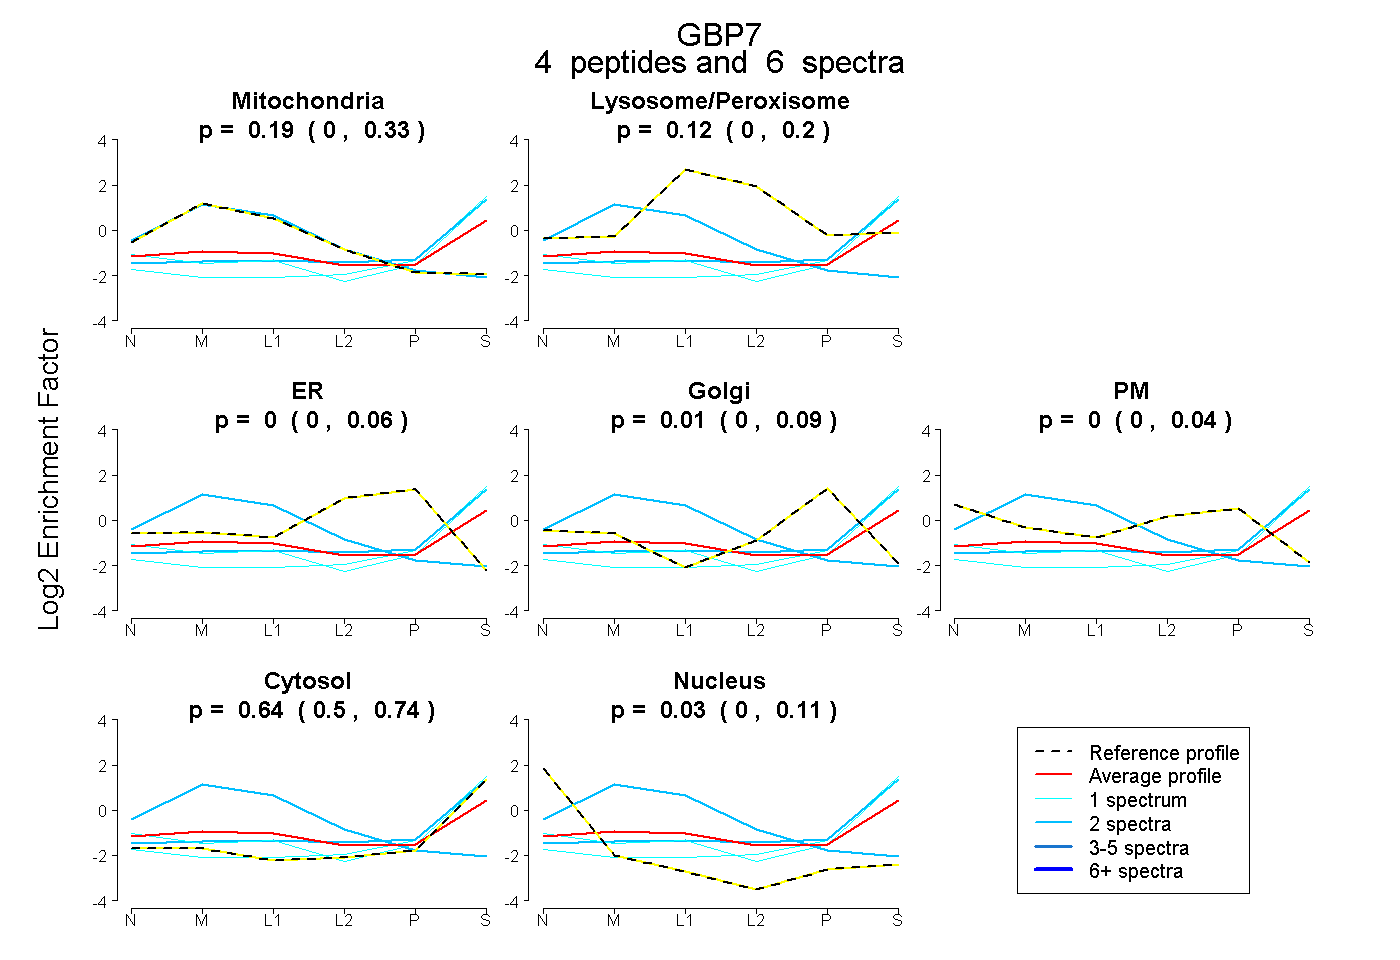
0.000 | 0.331
0.000 | 0.203
0.000 | 0.064
0.000 | 0.088
0.000 | 0.043
0.504 | 0.740
0.000 | 0.115
13peptides
spectra
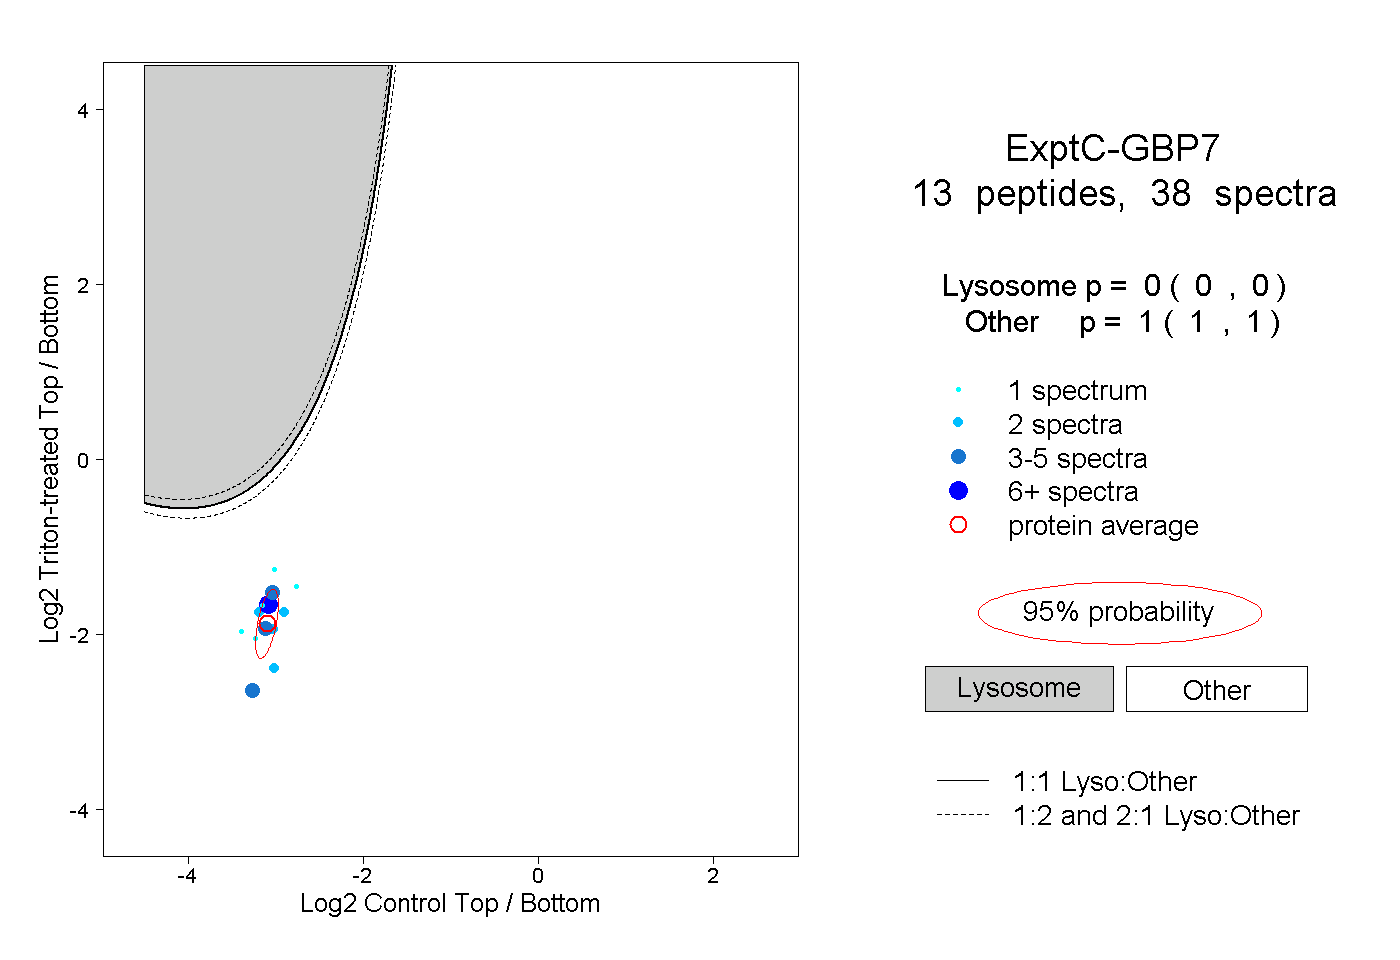
0.000 | 0.000
1.000 | 1.000
2peptides
spectra
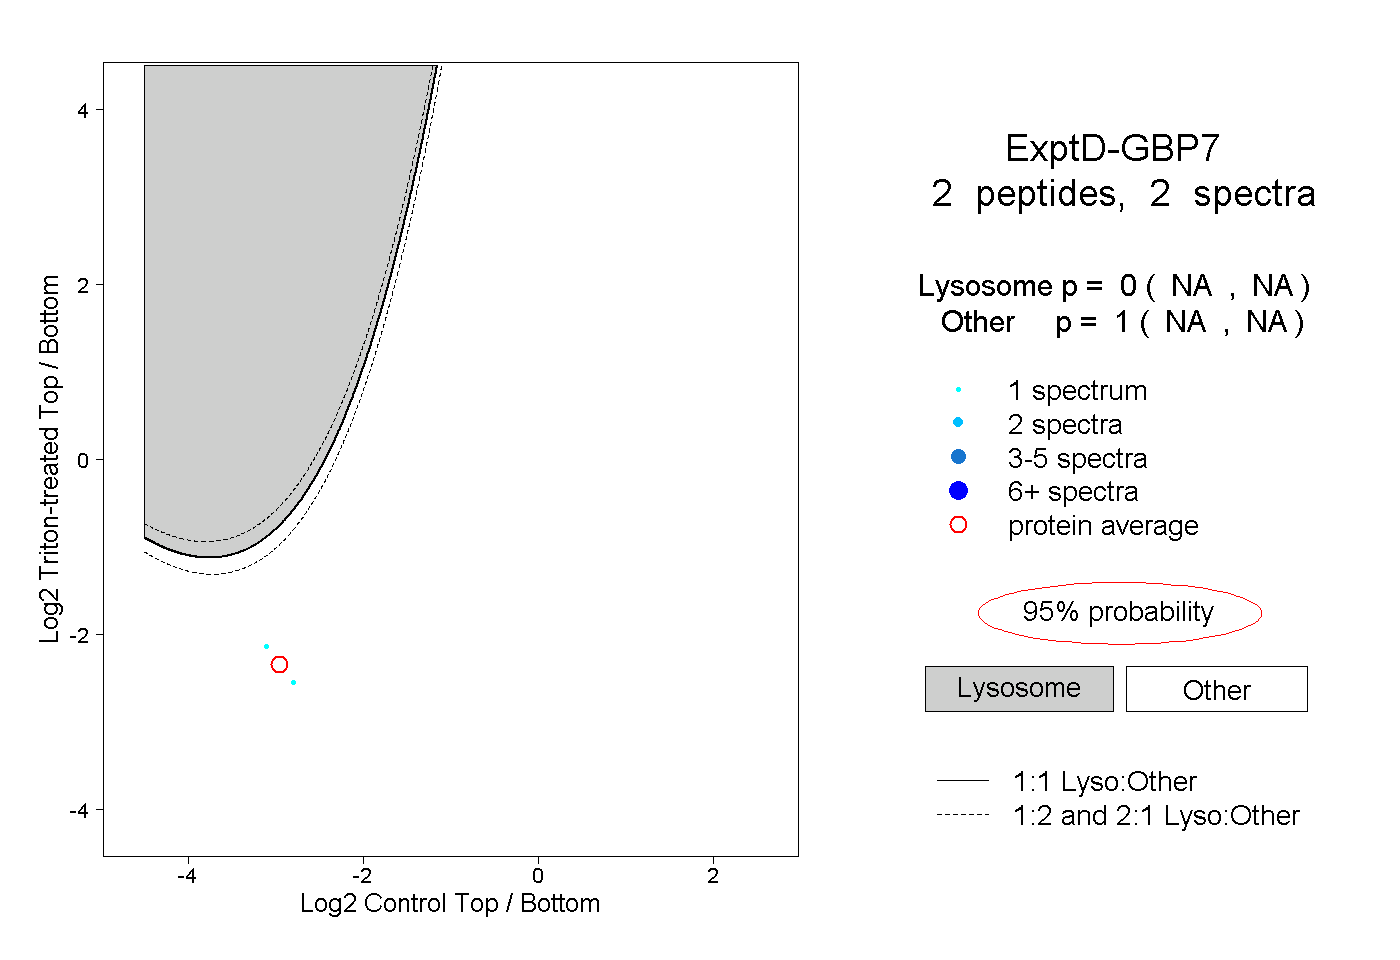
NA | NA
NA | NA