 12
12peptides
spectra
0.000 | 0.000
0.122 | 0.134
0.000 | 0.000
0.000 | 0.000
0.000 | 0.000
0.000 | 0.000
0.865 | 0.877
0.000 | 0.000
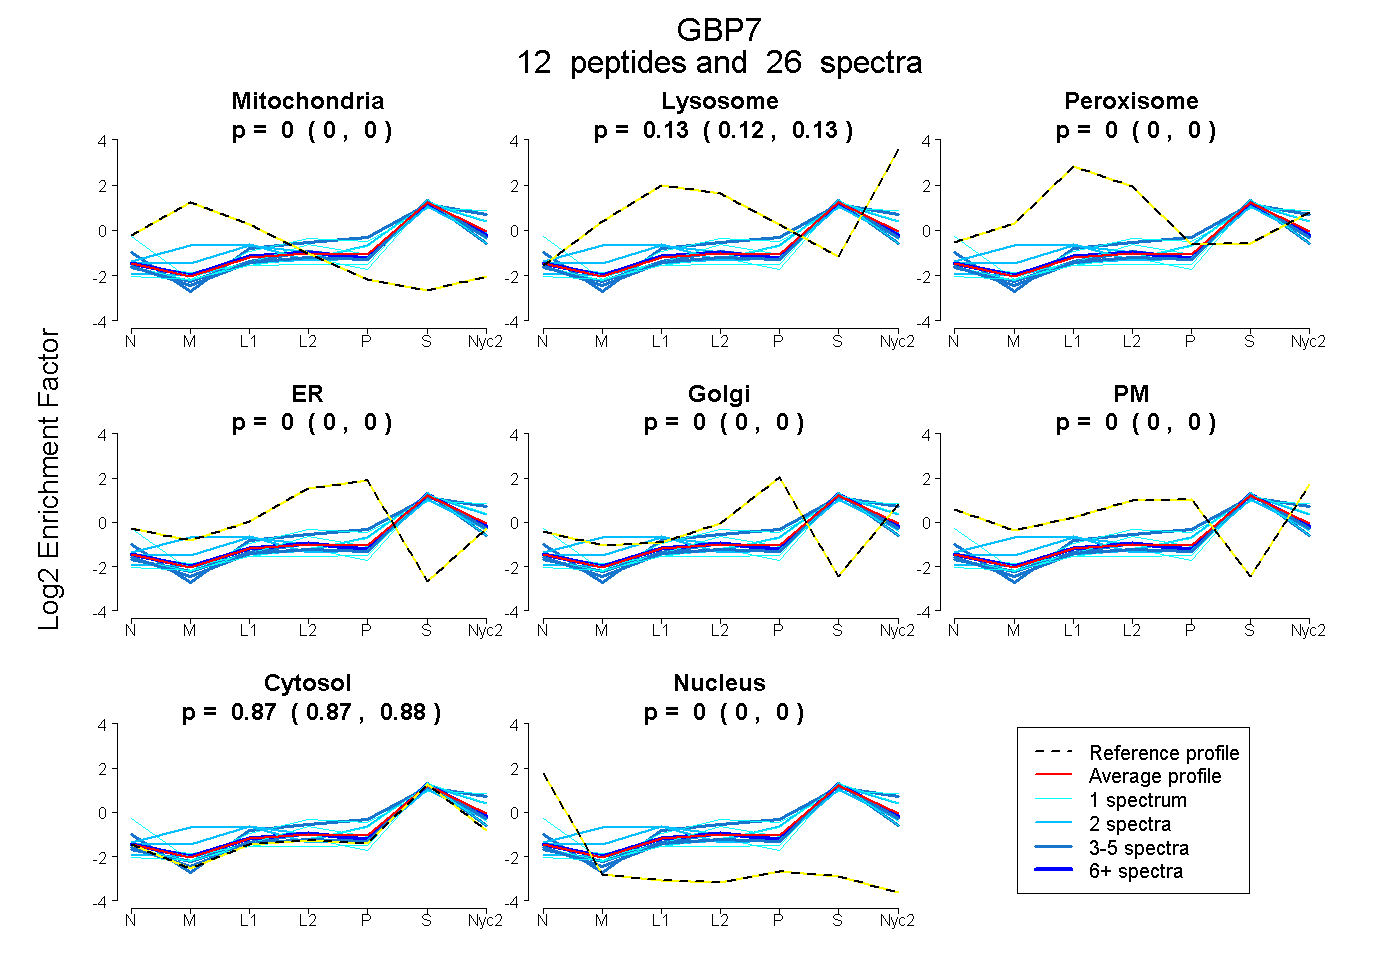
| Plot | Mito | Lyso | Perox | ER | Golgi | PM | Cytosol | Nucleus | |||||
| Expt A |
12 peptides |
26 spectra |
|
0.000 0.000 | 0.000 |
0.128 0.122 | 0.134 |
0.000 0.000 | 0.000 |
0.000 0.000 | 0.000 |
0.000 0.000 | 0.000 |
0.000 0.000 | 0.000 |
0.872 0.865 | 0.877 |
0.000 0.000 | 0.000 |
| 3 spectra, VITADEYLENALK | 0.000 | 0.053 | 0.000 | 0.000 | 0.000 | 0.000 | 0.947 | 0.000 | ||
| 1 spectrum, ENIVQLHEK | 0.028 | 0.046 | 0.000 | 0.000 | 0.000 | 0.000 | 0.926 | 0.000 | ||
| 1 spectrum, DFVLELK | 0.000 | 0.103 | 0.000 | 0.000 | 0.000 | 0.218 | 0.679 | 0.000 | ||
| 3 spectra, CFVFDRPIK | 0.000 | 0.059 | 0.000 | 0.000 | 0.000 | 0.000 | 0.941 | 0.000 | ||
| 2 spectra, AINILER | 0.000 | 0.081 | 0.000 | 0.000 | 0.046 | 0.000 | 0.873 | 0.000 | ||
| 1 spectrum, QIQQNK | 0.000 | 0.054 | 0.000 | 0.000 | 0.077 | 0.000 | 0.869 | 0.000 | ||
| 3 spectra, AQNSNLPR | 0.000 | 0.184 | 0.000 | 0.000 | 0.068 | 0.000 | 0.747 | 0.000 | ||
| 6 spectra, LAGQNHGFNLGTTVR | 0.000 | 0.113 | 0.000 | 0.000 | 0.000 | 0.000 | 0.887 | 0.000 | ||
| 1 spectrum, VQEEMLNEGFK | 0.000 | 0.011 | 0.000 | 0.000 | 0.000 | 0.000 | 0.989 | 0.000 | ||
| 1 spectrum, VEQDYEQVPR | 0.000 | 0.154 | 0.000 | 0.000 | 0.000 | 0.000 | 0.846 | 0.000 | ||
| 2 spectra, SYLMNR | 0.164 | 0.135 | 0.000 | 0.000 | 0.000 | 0.000 | 0.701 | 0.000 | ||
| 2 spectra, ELQQVMESQER | 0.000 | 0.218 | 0.000 | 0.000 | 0.000 | 0.000 | 0.782 | 0.000 |
| Plot | Mito | Lyso or Perox | ER | Golgi | PM | Cytosol | Nucleus | ||||||
| Expt B |
4 peptides |
6 spectra |
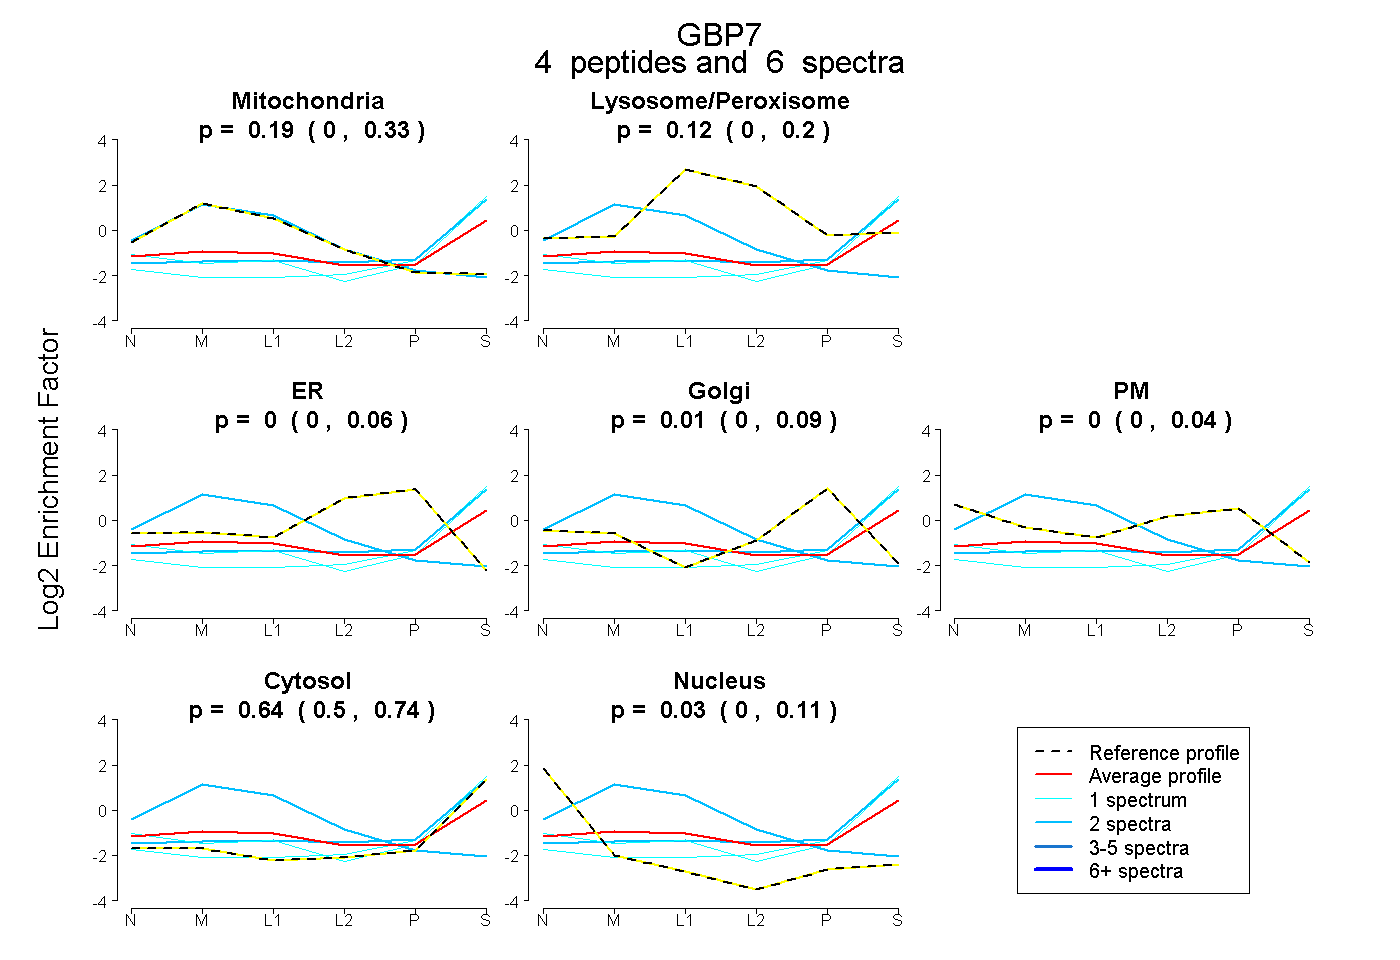 |
0.194 0.000 | 0.331 |
0.117 0.000 | 0.203 |
0.000 0.000 | 0.064 |
0.015 0.000 | 0.088 |
0.000 0.000 | 0.043 |
0.641 0.504 | 0.740 |
0.033 0.000 | 0.115 |
|||
| Plot | Lyso | Other | |||||||||||
| Expt C |
13 peptides |
38 spectra |
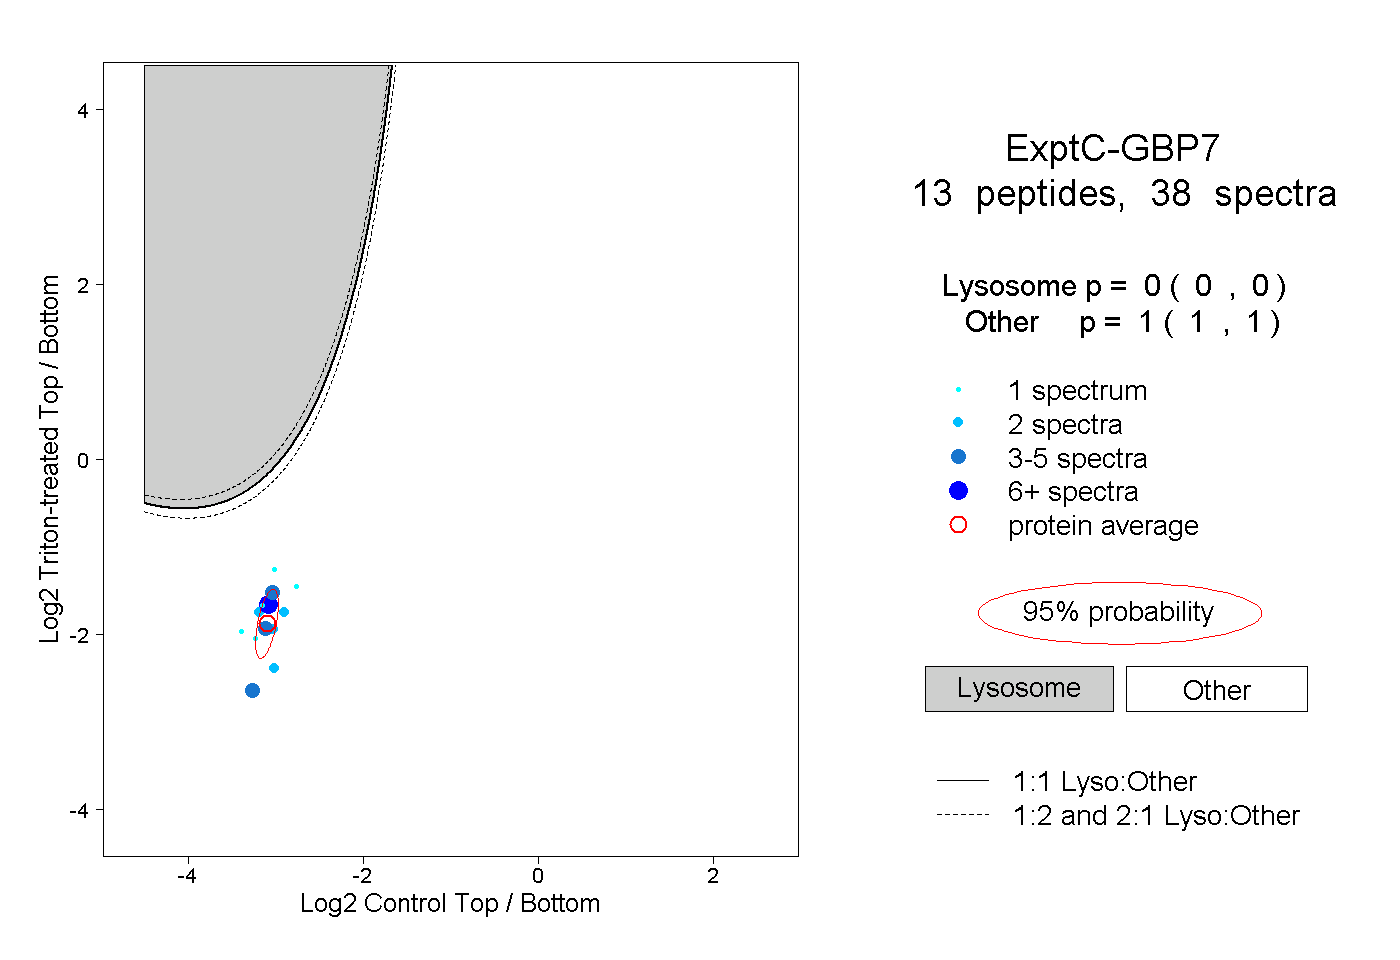 |
0.000 0.000 | 0.000 |
1.000 1.000 | 1.000 |
||||||||
| Plot | Lyso | Other | |||||||||||
| Expt D |
2 peptides |
2 spectra |
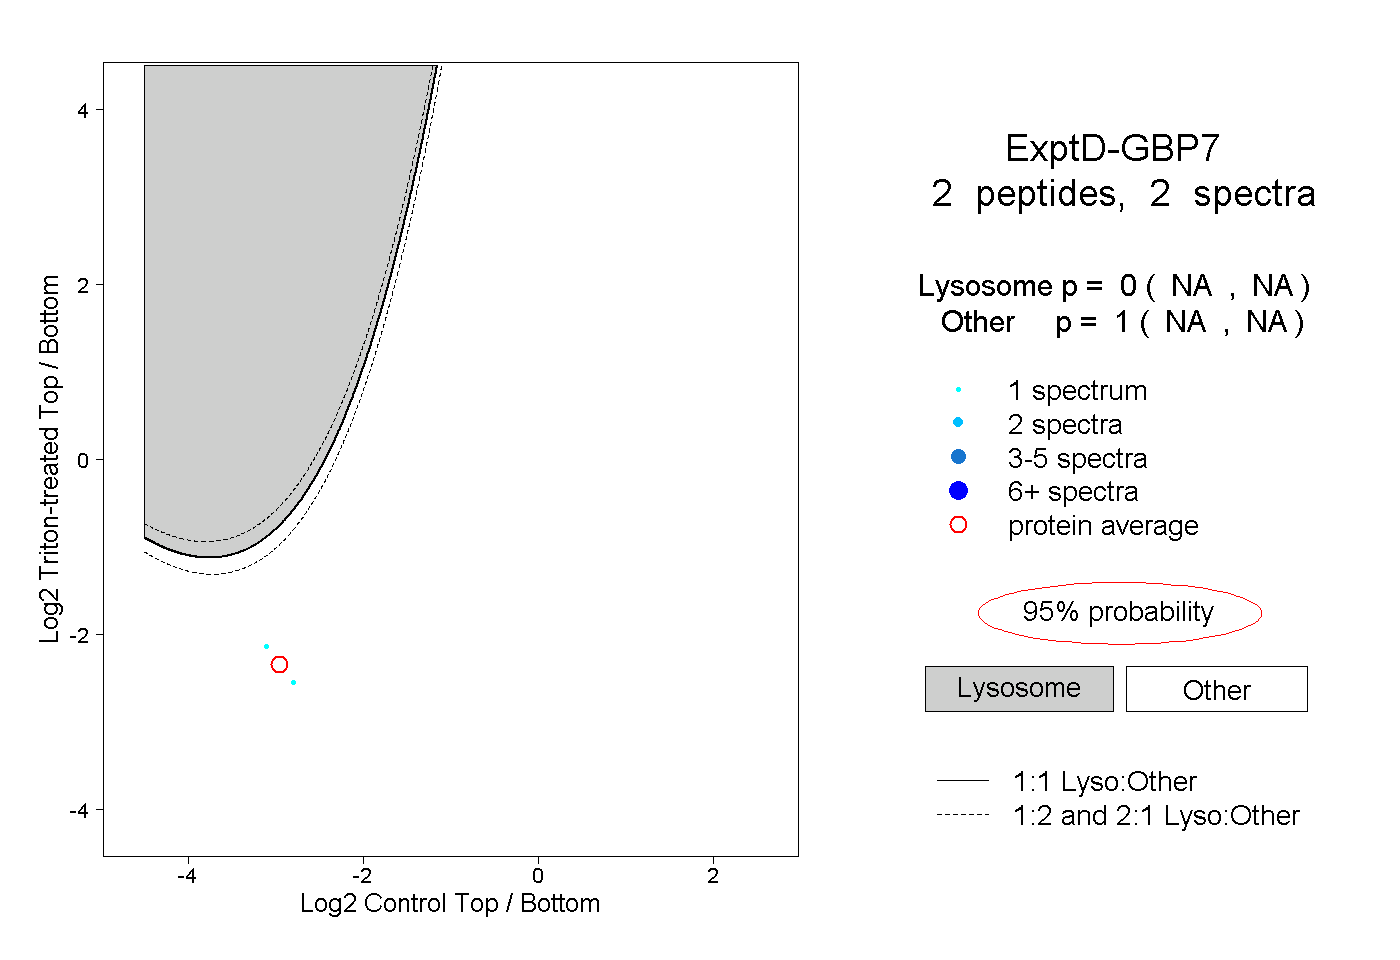 |
0.000 NA | NA |
1.000 NA | NA |