 16
16peptides
spectra
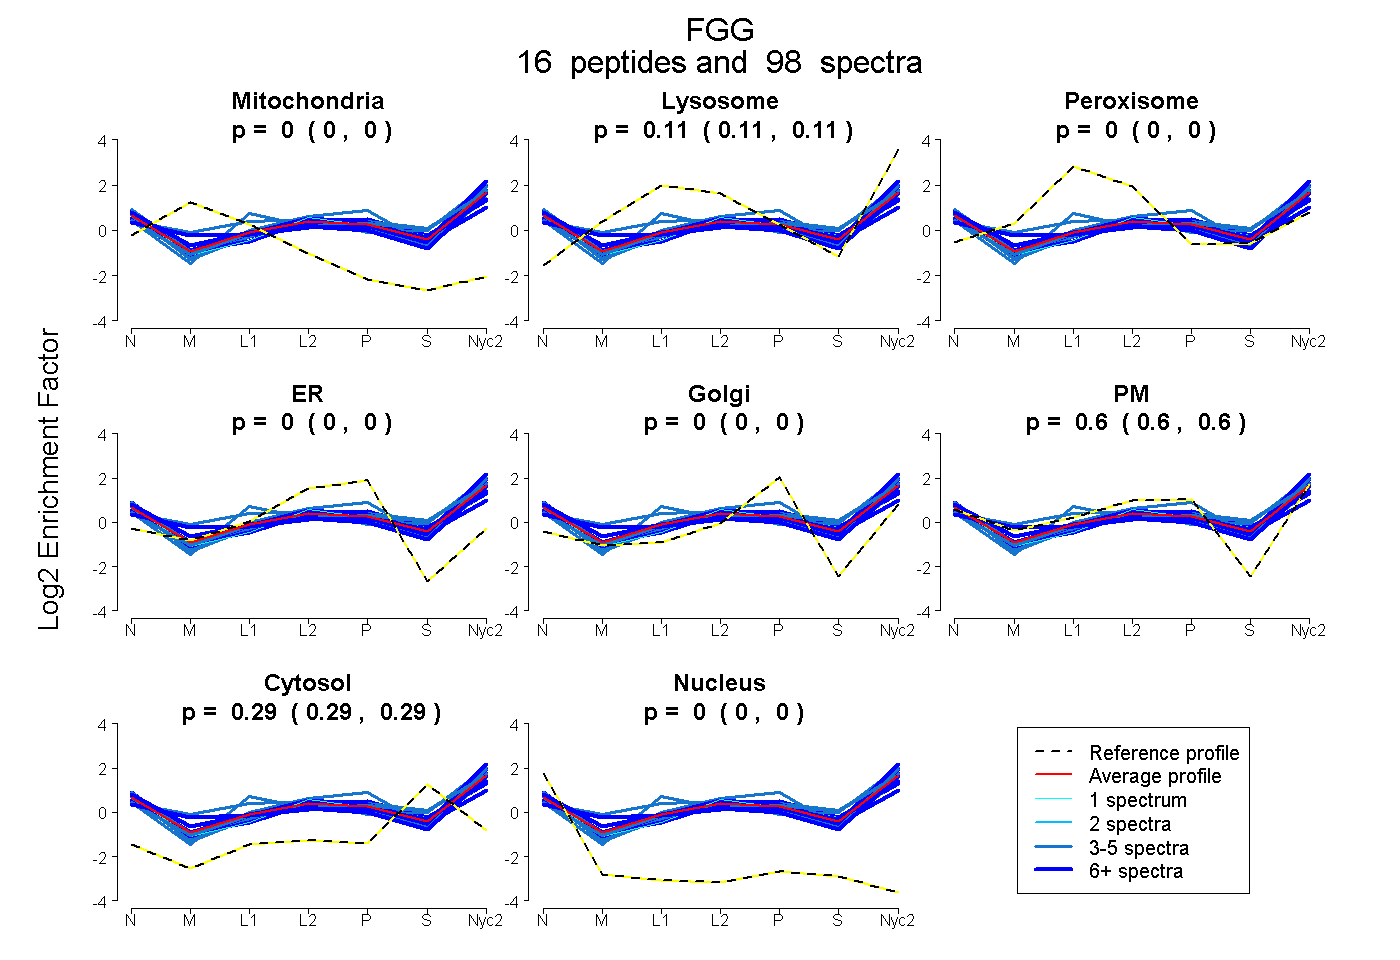
0.000 | 0.000
0.107 | 0.114
0.000 | 0.000
0.000 | 0.000
0.000 | 0.000
0.596 | 0.603
0.288 | 0.291
0.000 | 0.000
8peptides
spectra
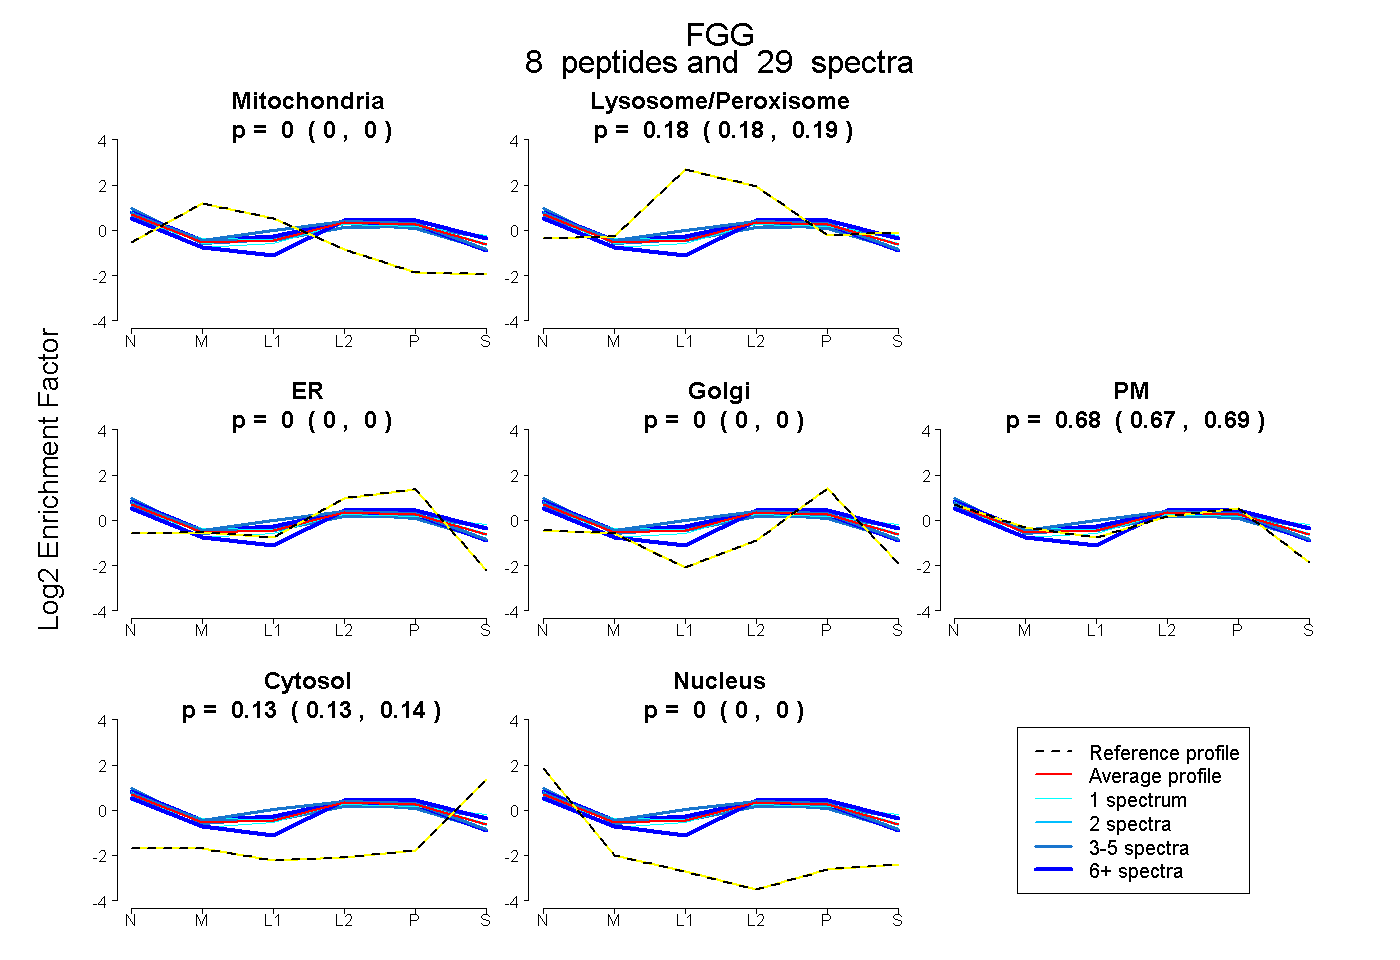
0.000 | 0.000
0.175 | 0.193
0.000 | 0.000
0.000 | 0.000
0.673 | 0.692
0.126 | 0.136
0.000 | 0.000
16peptides
spectra
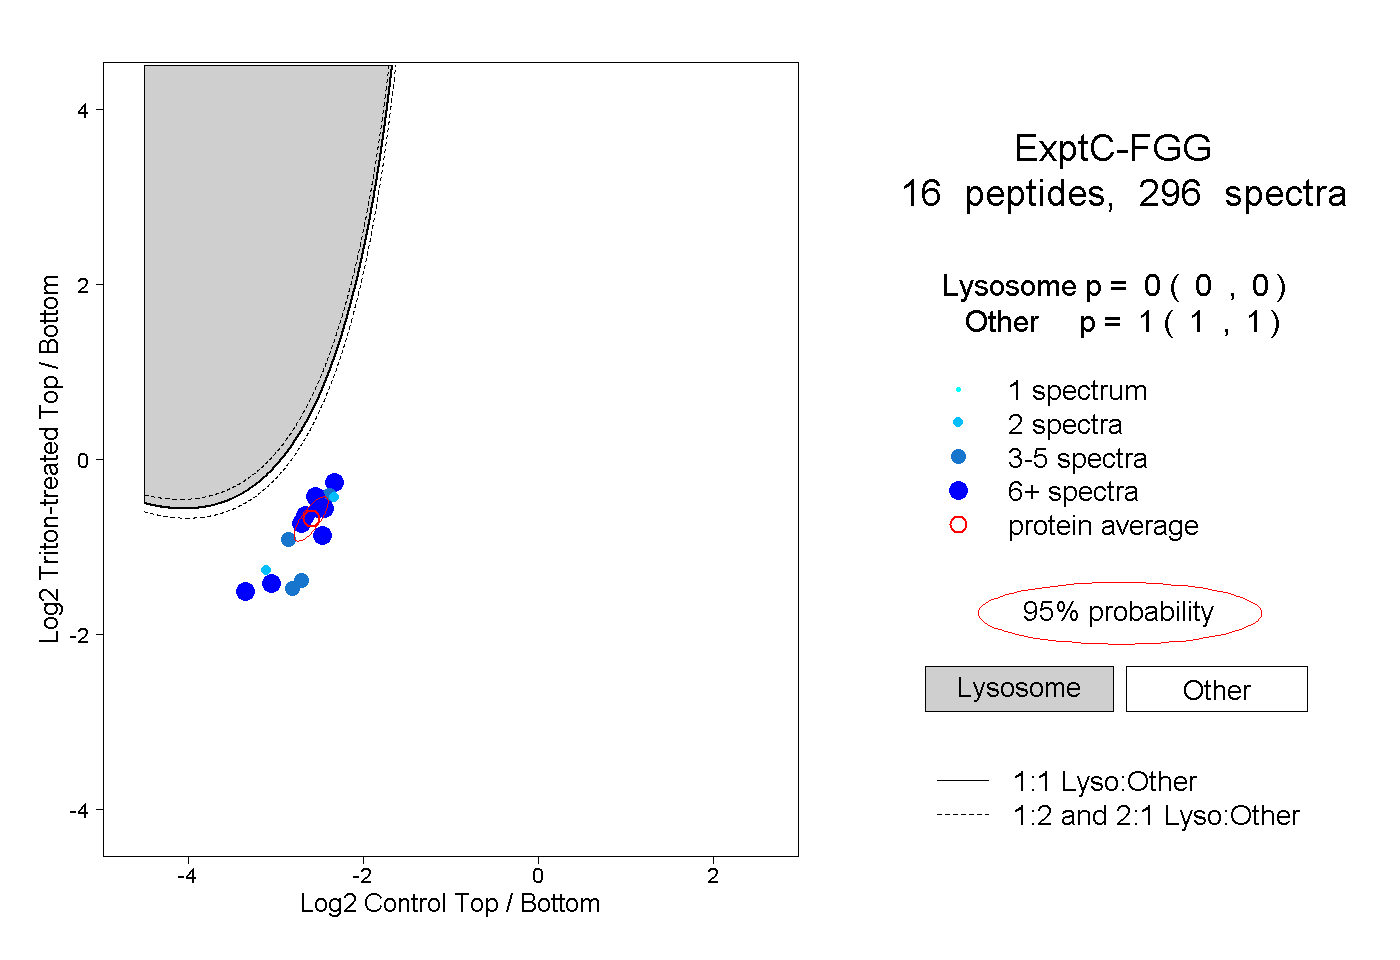
0.000 | 0.000
1.000 | 1.000
9peptides
spectra
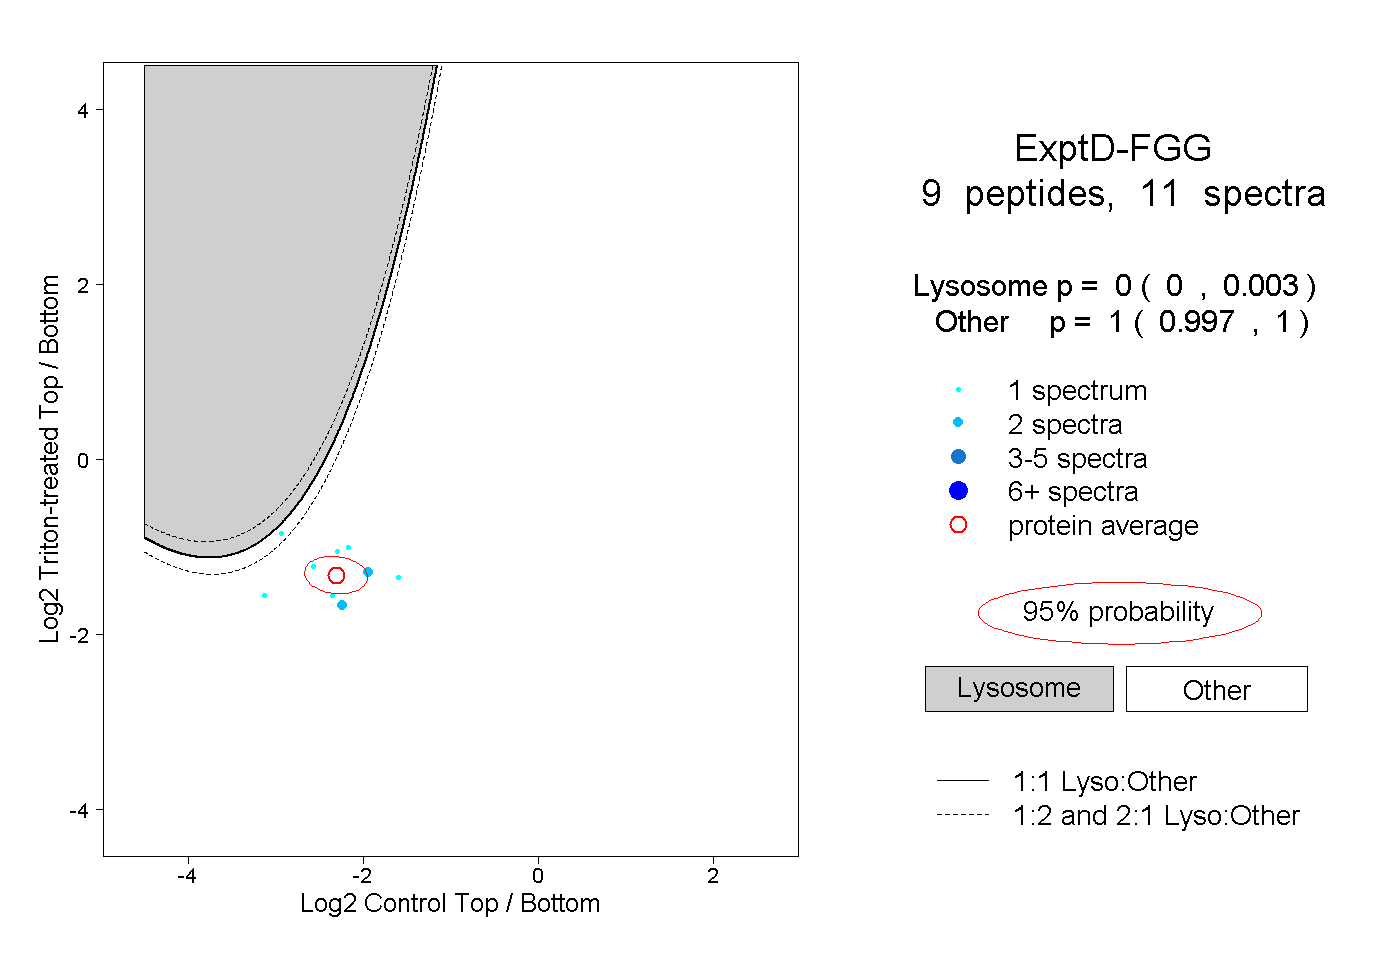
0.000 | 0.003
0.997 | 1.000