FGG
[ENSRNOP00000032735]
Main page
| | | Plot |
Mito |
Lyso |
|
Perox |
ER |
Golgi |
PM |
Cytosol |
Nucleus |
|
| Expt A |
 16
16
peptides |
98
spectra |
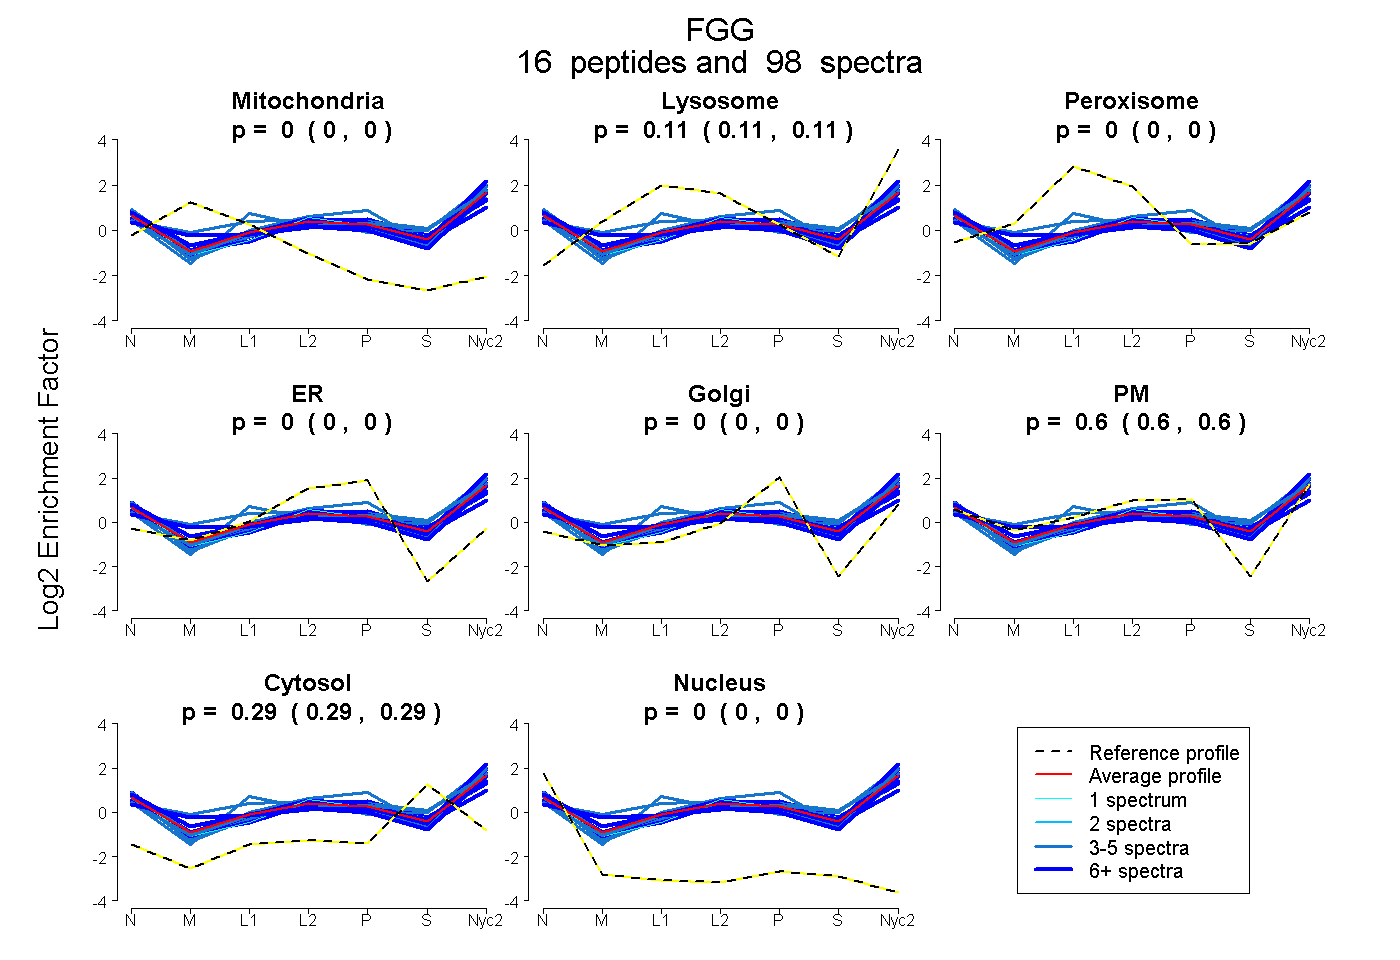 |
0.000
0.000 | 0.000 |
0.111
0.107 | 0.114 |
|
0.000
0.000 | 0.000 |
0.000
0.000 | 0.000 |
0.000
0.000 | 0.000 |
0.600
0.596 | 0.603 |
0.290
0.288 | 0.291 |
0.000
0.000 | 0.000 |
|
| | | Plot |
Mito |
|
Lyso or Perox |
|
ER |
Golgi |
PM |
Cytosol |
Nucleus |
|
| Expt B |
8
peptides |
29
spectra |
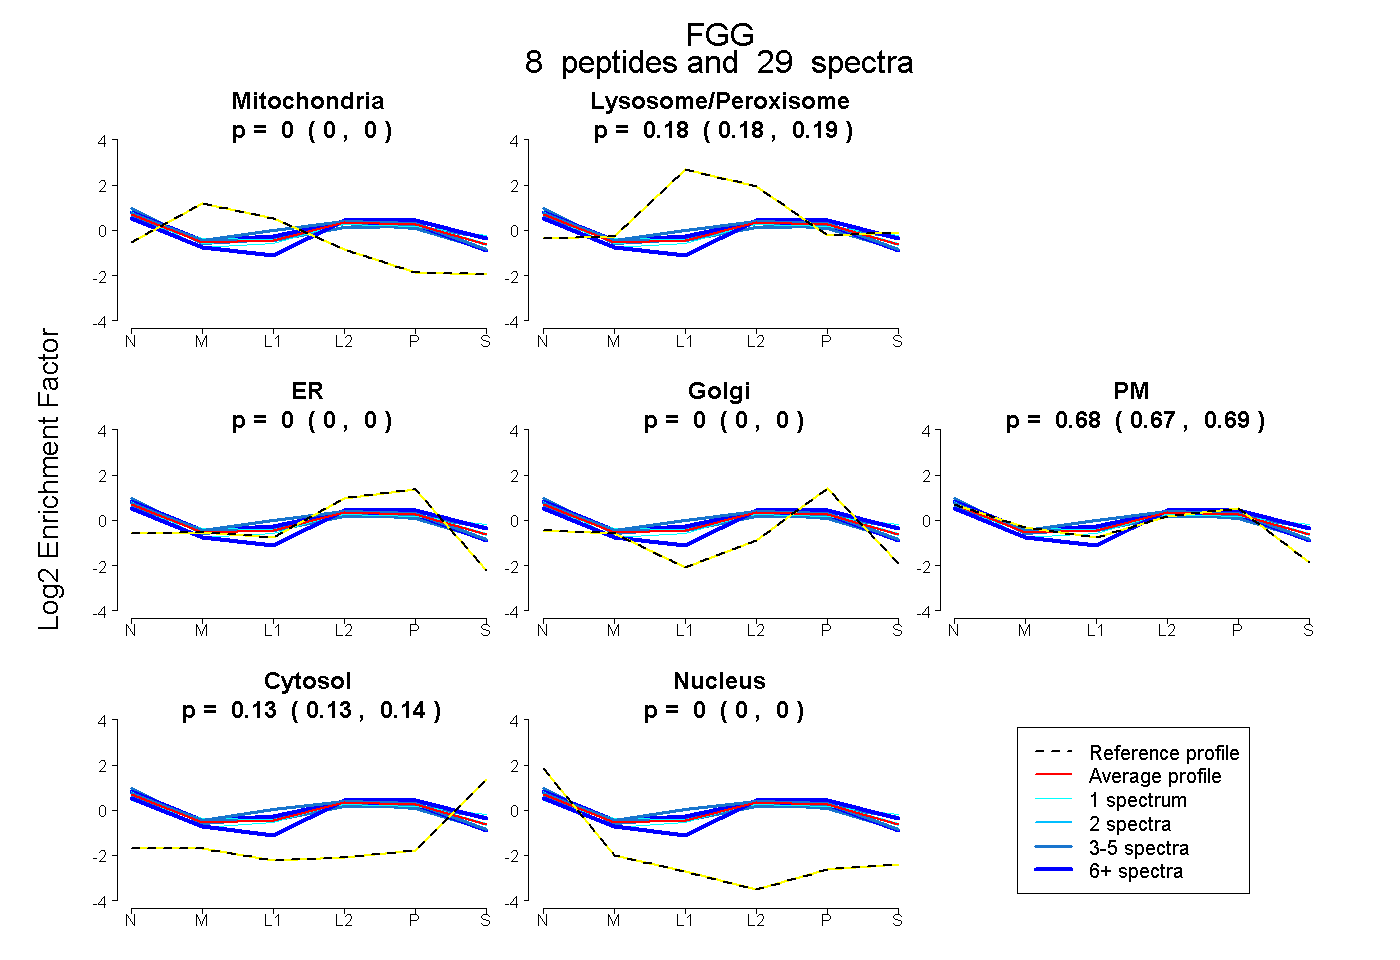 |
0.000
0.000 | 0.000 |
|
0.185
0.175 | 0.193 |
|
0.000
0.000 | 0.000 |
0.000
0.000 | 0.000 |
0.683
0.673 | 0.692 |
0.132
0.126 | 0.136 |
0.000
0.000 | 0.000 |
|
| 3 spectra, YLQDIYTSNK |
0.000 |
|
0.264 |
|
0.000 |
0.000 |
0.662 |
0.058 |
0.015 |
|
| 1 spectrum, LDGSVDFK |
0.000 |
|
0.241 |
|
0.000 |
0.000 |
0.563 |
0.195 |
0.000 |
|
| 10 spectra, ESGLYFIRPLK |
0.000 |
|
0.205 |
|
0.000 |
0.000 |
0.708 |
0.068 |
0.019 |
|
| 3 spectra, DNCCILDER |
0.000 |
|
0.219 |
|
0.000 |
0.000 |
0.647 |
0.059 |
0.075 |
|
| 1 spectrum, NWIQYK |
0.000 |
|
0.182 |
|
0.000 |
0.000 |
0.697 |
0.121 |
0.000 |
|
| 1 spectrum, MVEEILK |
0.000 |
|
0.164 |
|
0.000 |
0.000 |
0.697 |
0.139 |
0.000 |
|
| 6 spectra, TSTADYAMFR |
0.000 |
|
0.100 |
|
0.034 |
0.000 |
0.669 |
0.196 |
0.000 |
|
| 4 spectra, IIPFNR |
0.000 |
|
0.205 |
|
0.000 |
0.000 |
0.606 |
0.189 |
0.000 |
|
| | | Plot |
|
Lyso |
|
|
|
|
|
|
|
Other |
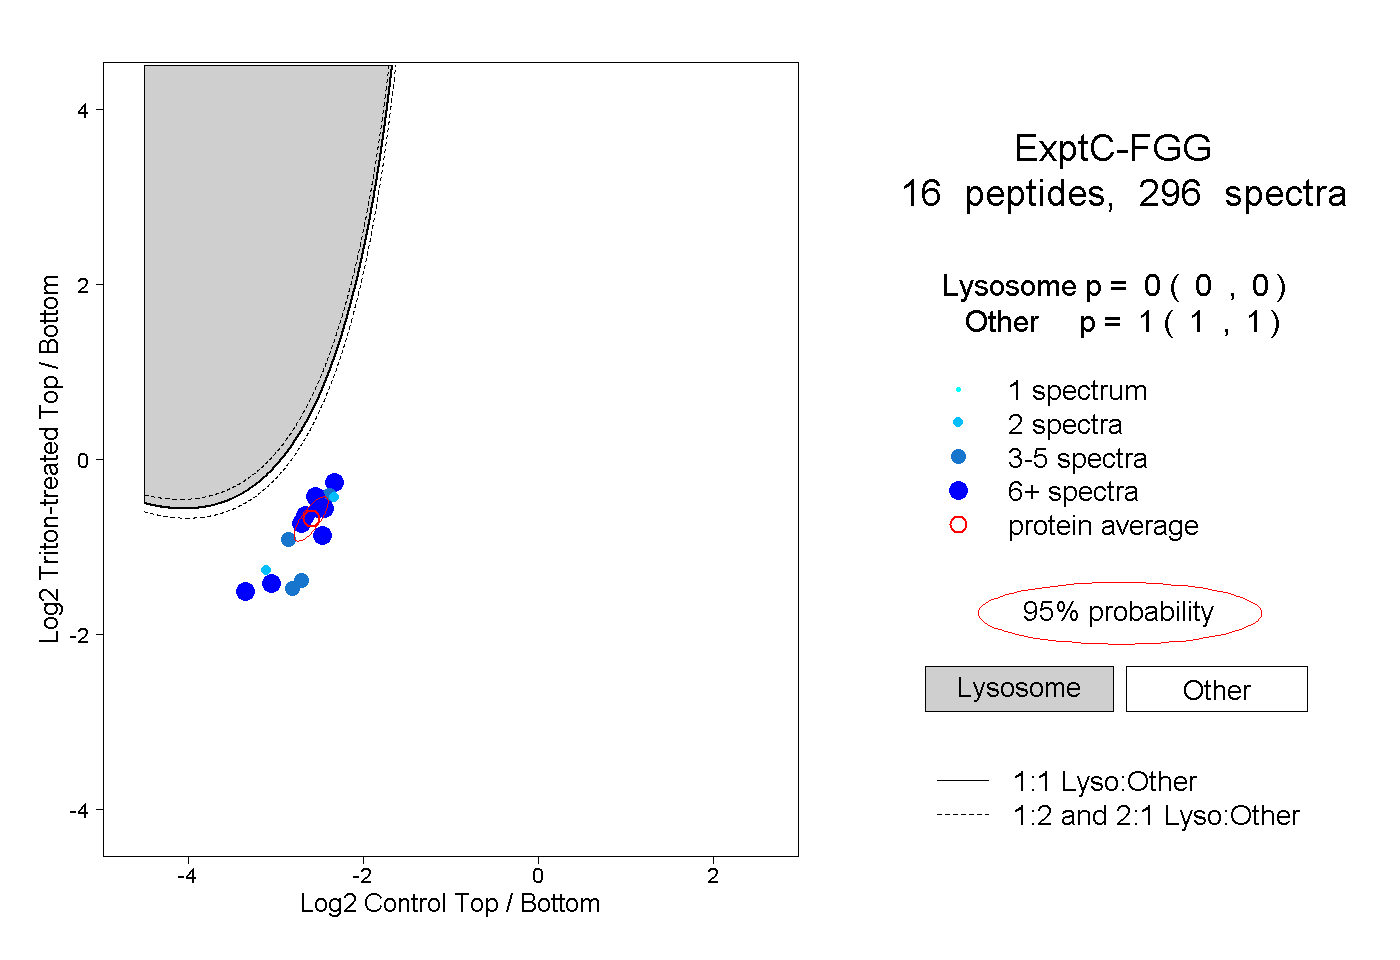
| Expt C |
16
peptides |
296
spectra |
 |
|
0.000
0.000 | 0.000 |
|
|
|
|
|
|
|
1.000
1.000 | 1.000 |
| | | Plot |
|
Lyso |
|
|
|
|
|
|
|
Other |
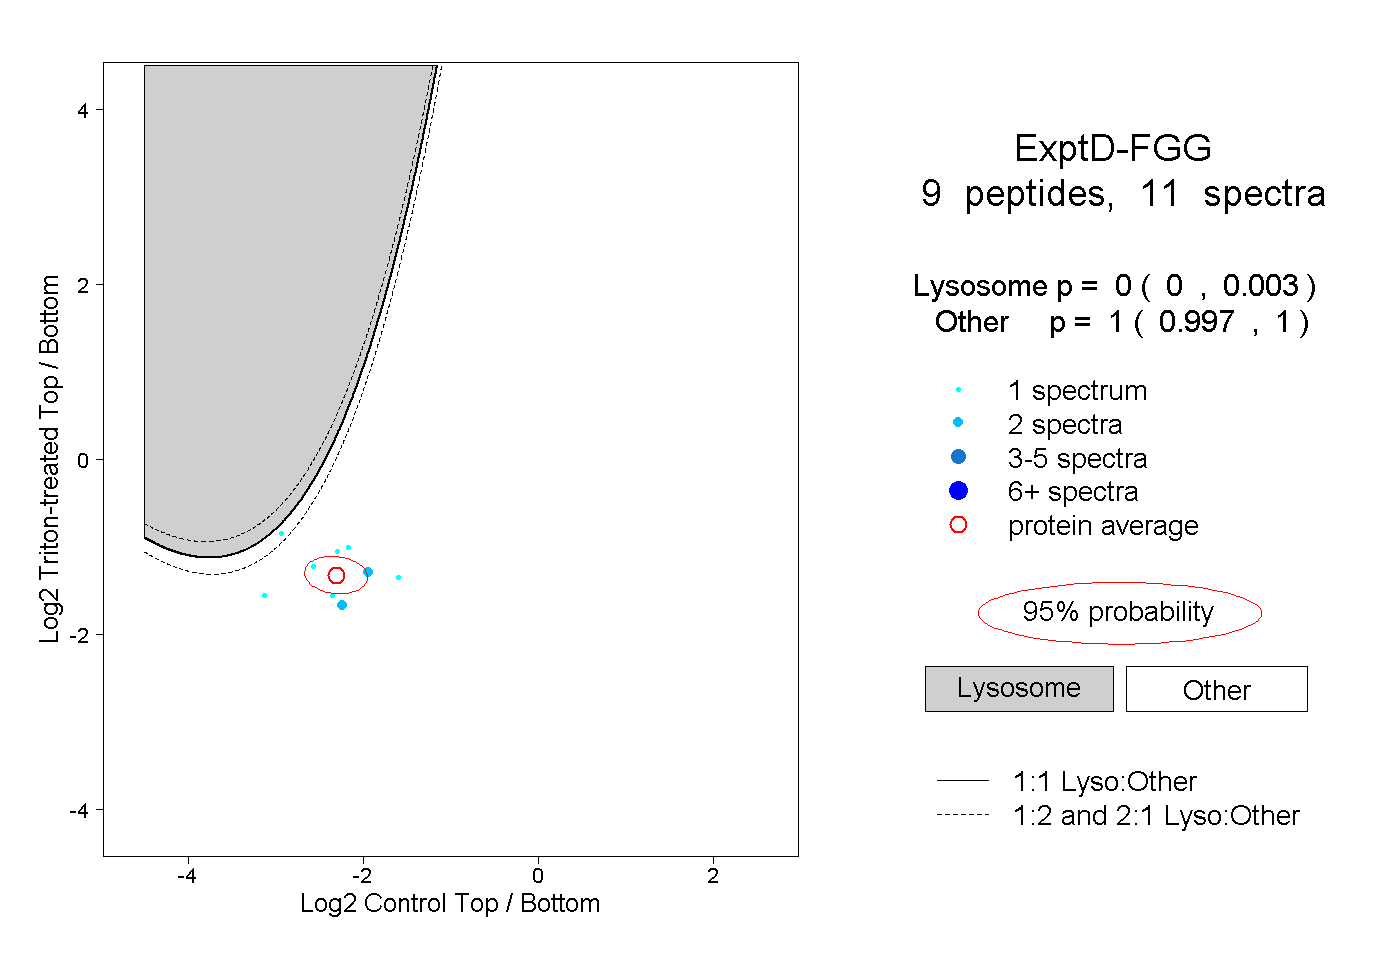
| Expt D |
9
peptides |
11
spectra |
 |
|
0.000
0.000 | 0.003 |
|
|
|
|
|
|
|
1.000
0.997 | 1.000 |