 74
74peptides
spectra
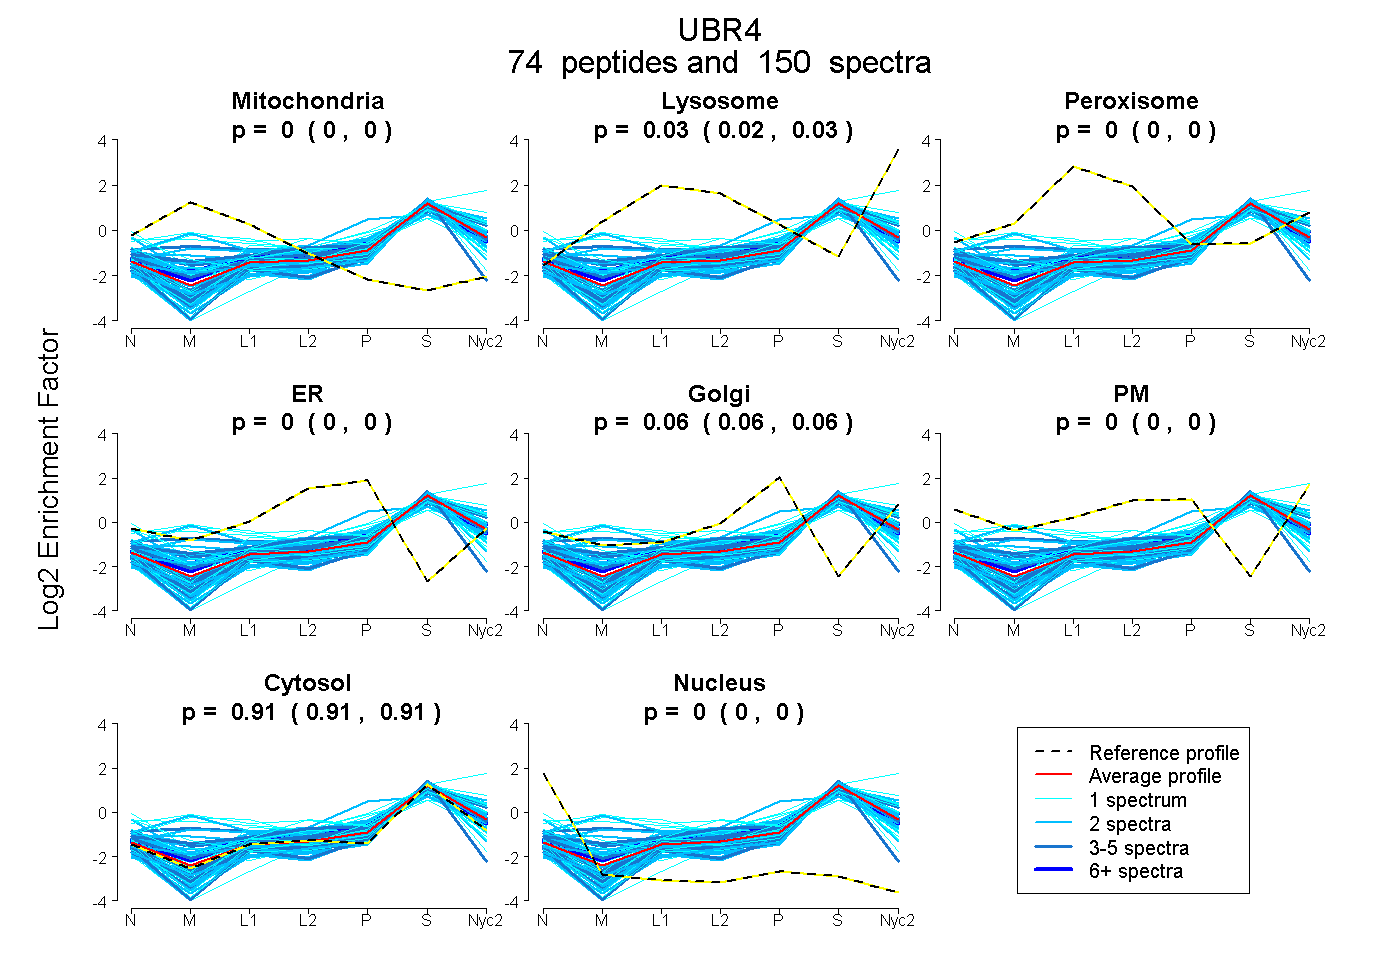
0.000 | 0.000
0.025 | 0.028
0.000 | 0.000
0.000 | 0.000
0.061 | 0.064
0.000 | 0.000
0.909 | 0.912
0.000 | 0.000
17peptides
spectra
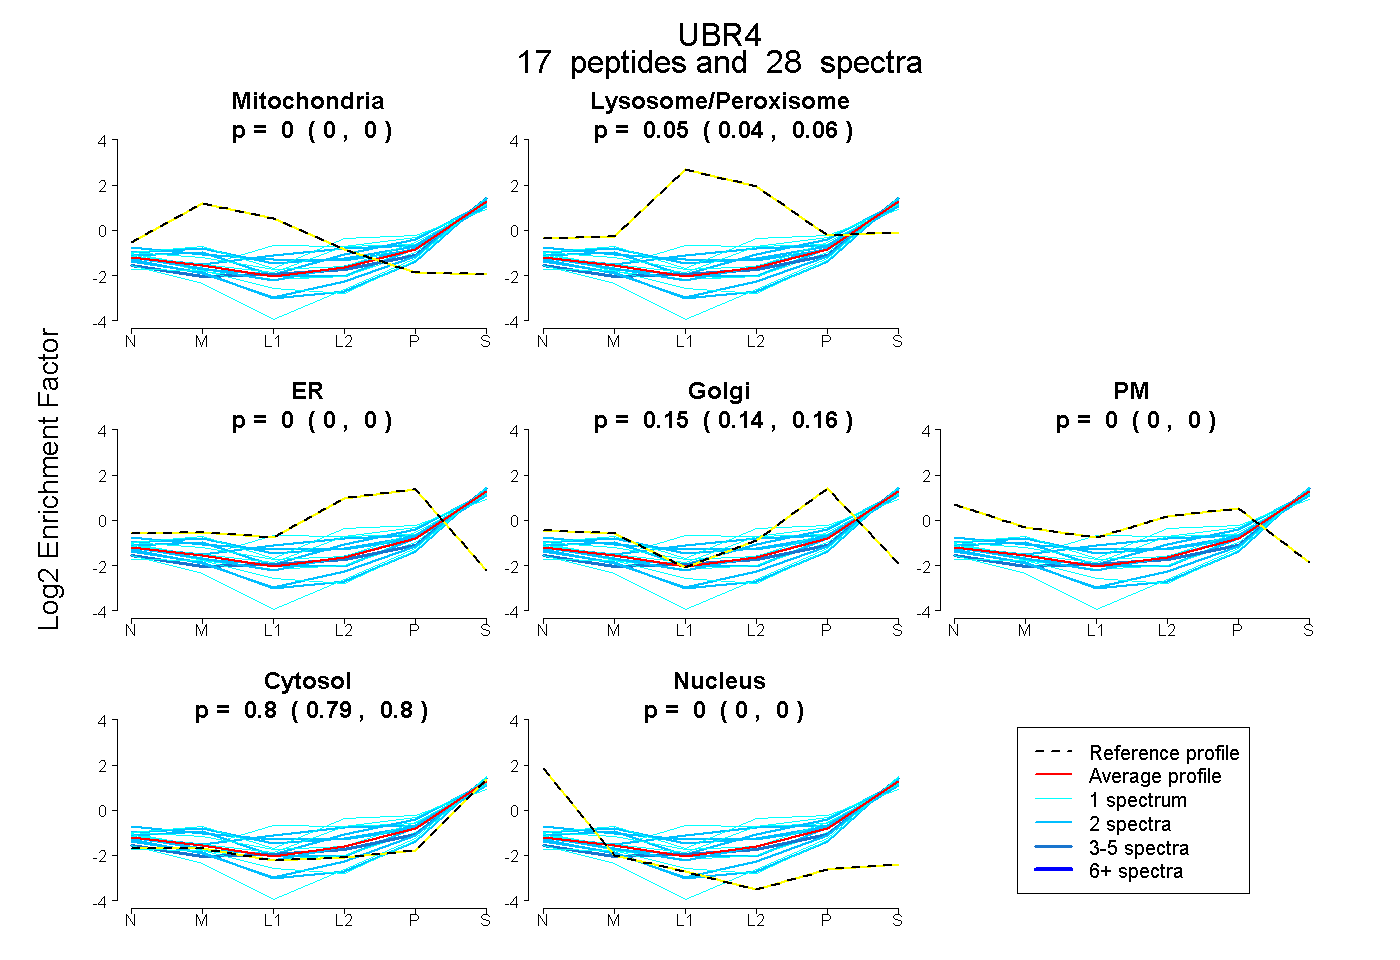
0.000 | 0.000
0.039 | 0.061
0.000 | 0.000
0.143 | 0.158
0.000 | 0.000
0.790 | 0.804
0.000 | 0.000
44peptides
spectra
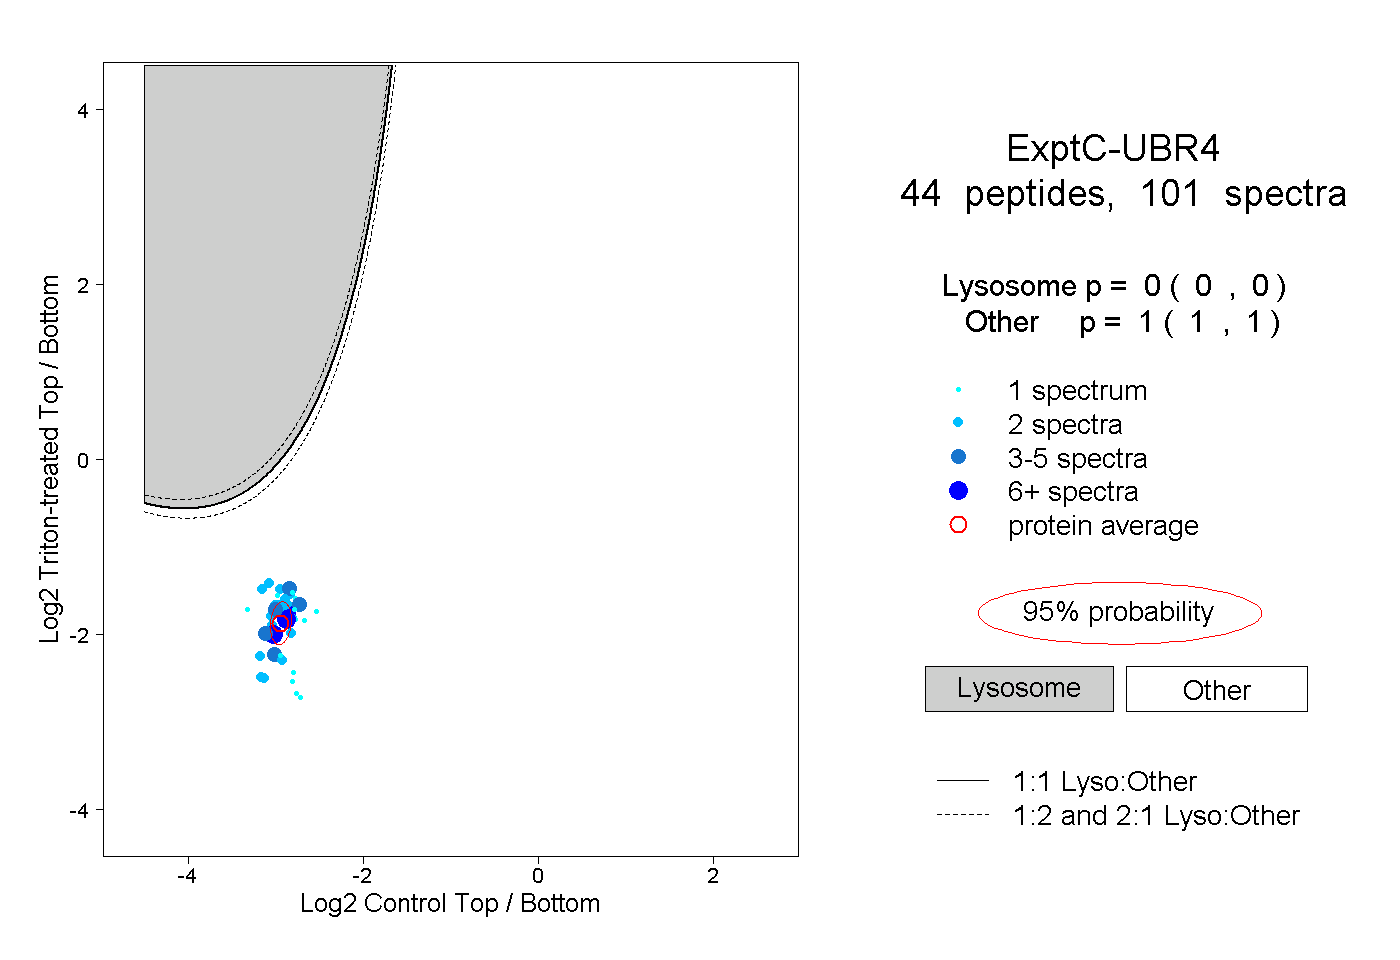
0.000 | 0.000
1.000 | 1.000
4peptides
spectra
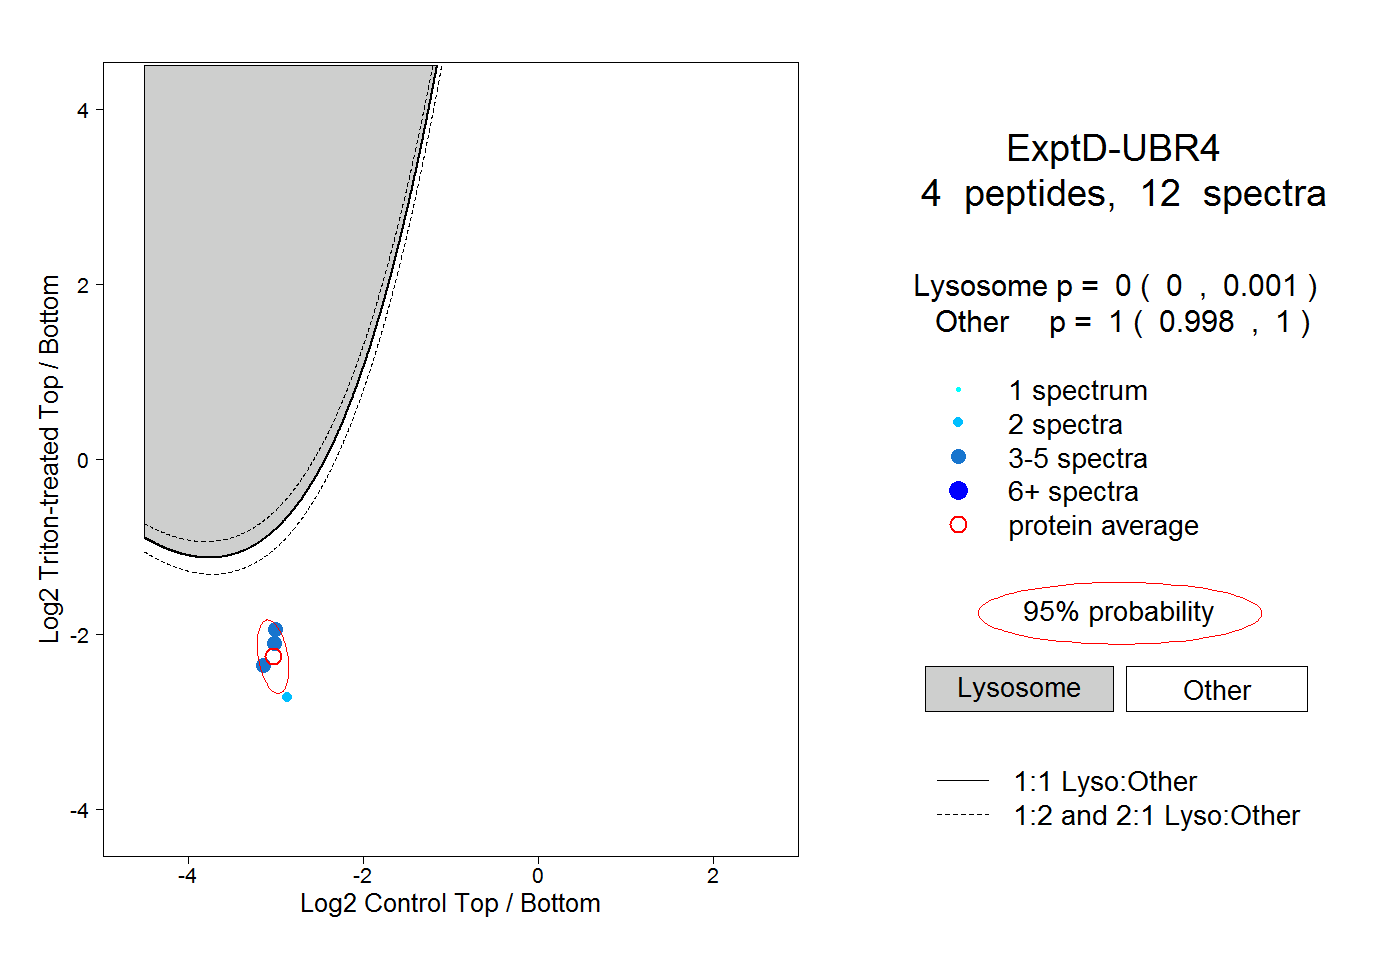
0.000 | 0.001
0.998 | 1.000