UBR4
[ENSRNOP00000032156]
Main page
| | | Plot |
Mito |
Lyso |
|
Perox |
ER |
Golgi |
PM |
Cytosol |
Nucleus |
|
| Expt A |
 74
74
peptides |
150
spectra |
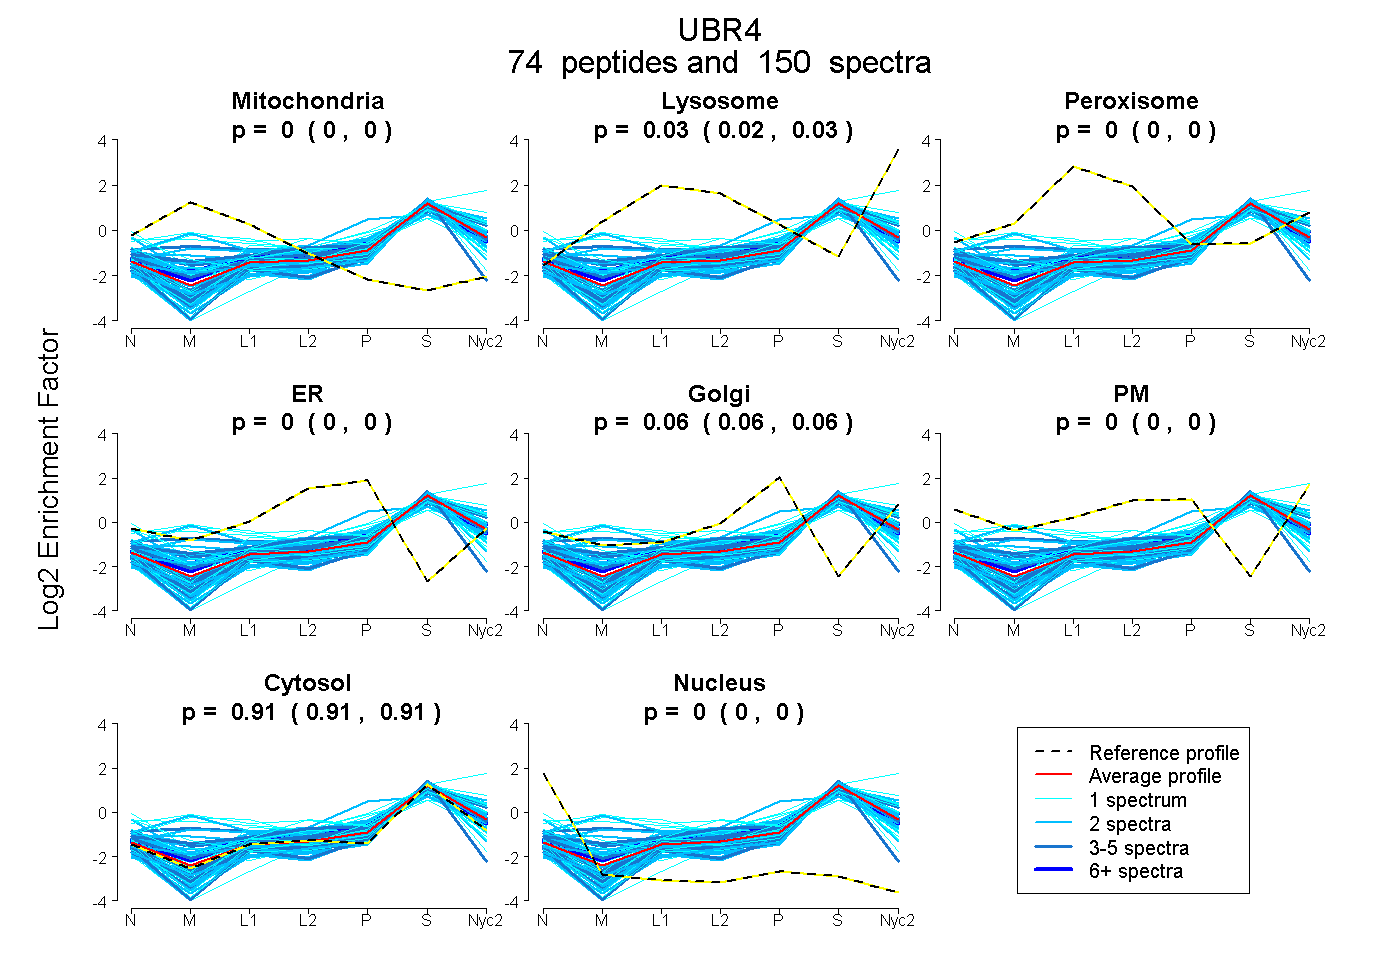 |
0.000
0.000 | 0.000 |
0.026
0.025 | 0.028 |
|
0.000
0.000 | 0.000 |
0.000
0.000 | 0.000 |
0.063
0.061 | 0.064 |
0.000
0.000 | 0.000 |
0.911
0.909 | 0.912 |
0.000
0.000 | 0.000 |
|
| | | Plot |
Mito |
|
Lyso or Perox |
|
ER |
Golgi |
PM |
Cytosol |
Nucleus |
|
| Expt B |
17
peptides |
28
spectra |
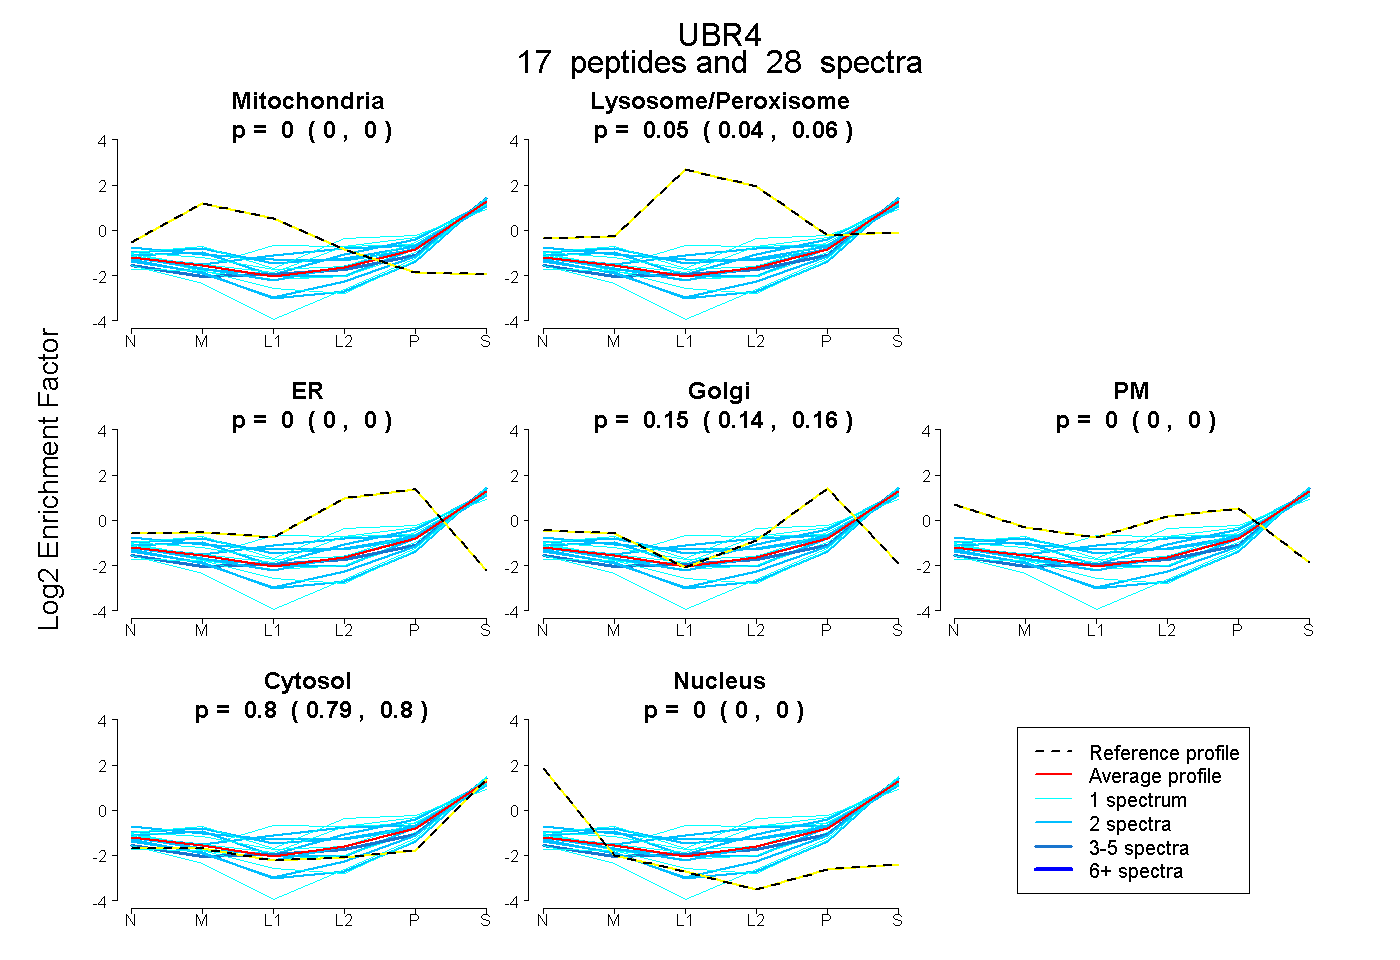 |
0.000
0.000 | 0.000 |
|
0.051
0.039 | 0.061 |
|
0.000
0.000 | 0.000 |
0.151
0.143 | 0.158 |
0.000
0.000 | 0.000 |
0.798
0.790 | 0.804 |
0.000
0.000 | 0.000 |
|
| 1 spectrum, IIPYLSFGEVEK |
0.000 |
|
0.059 |
|
0.241 |
0.000 |
0.000 |
0.700 |
0.000 |
|
| 4 spectra, HALLSLVR |
0.000 |
|
0.040 |
|
0.032 |
0.025 |
0.000 |
0.904 |
0.000 |
|
| 2 spectra, GNILASR |
0.000 |
|
0.163 |
|
0.000 |
0.148 |
0.022 |
0.667 |
0.000 |
|
| 2 spectra, EEALQADR |
0.000 |
|
0.039 |
|
0.168 |
0.044 |
0.000 |
0.749 |
0.000 |
|
| 2 spectra, SFAATVSR |
0.000 |
|
0.000 |
|
0.000 |
0.062 |
0.000 |
0.912 |
0.026 |
|
| 1 spectrum, SNPSVLQGLLR |
0.000 |
|
0.000 |
|
0.000 |
0.000 |
0.000 |
0.950 |
0.050 |
|
| 2 spectra, HILVSQGLIR |
0.000 |
|
0.138 |
|
0.000 |
0.000 |
0.170 |
0.691 |
0.000 |
|
| 1 spectrum, APSYIEIFGR |
0.000 |
|
0.000 |
|
0.000 |
0.177 |
0.000 |
0.823 |
0.000 |
|
| 1 spectrum, ALATNPALR |
0.000 |
|
0.315 |
|
0.000 |
0.046 |
0.000 |
0.640 |
0.000 |
|
| 1 spectrum, ELLEYDLQQR |
0.000 |
|
0.000 |
|
0.000 |
0.110 |
0.022 |
0.865 |
0.003 |
|
| 2 spectra, DLHTLDSHVR |
0.000 |
|
0.232 |
|
0.045 |
0.032 |
0.000 |
0.692 |
0.000 |
|
| 2 spectra, LQAWLTR |
0.000 |
|
0.027 |
|
0.000 |
0.158 |
0.000 |
0.815 |
0.000 |
|
| 2 spectra, SAPLILAR |
0.000 |
|
0.000 |
|
0.000 |
0.000 |
0.000 |
0.936 |
0.064 |
|
| 1 spectrum, WFDFPFTR |
0.000 |
|
0.000 |
|
0.000 |
0.000 |
0.000 |
0.986 |
0.014 |
|
| 1 spectrum, VSESLVR |
0.000 |
|
0.092 |
|
0.000 |
0.201 |
0.000 |
0.707 |
0.000 |
|
| 2 spectra, AVAPGGATR |
0.000 |
|
0.028 |
|
0.000 |
0.196 |
0.000 |
0.775 |
0.000 |
|
| 1 spectrum, NLQGFLEQPR |
0.000 |
|
0.136 |
|
0.202 |
0.088 |
0.000 |
0.573 |
0.000 |
|
| | | Plot |
|
Lyso |
|
|
|
|
|
|
|
Other |
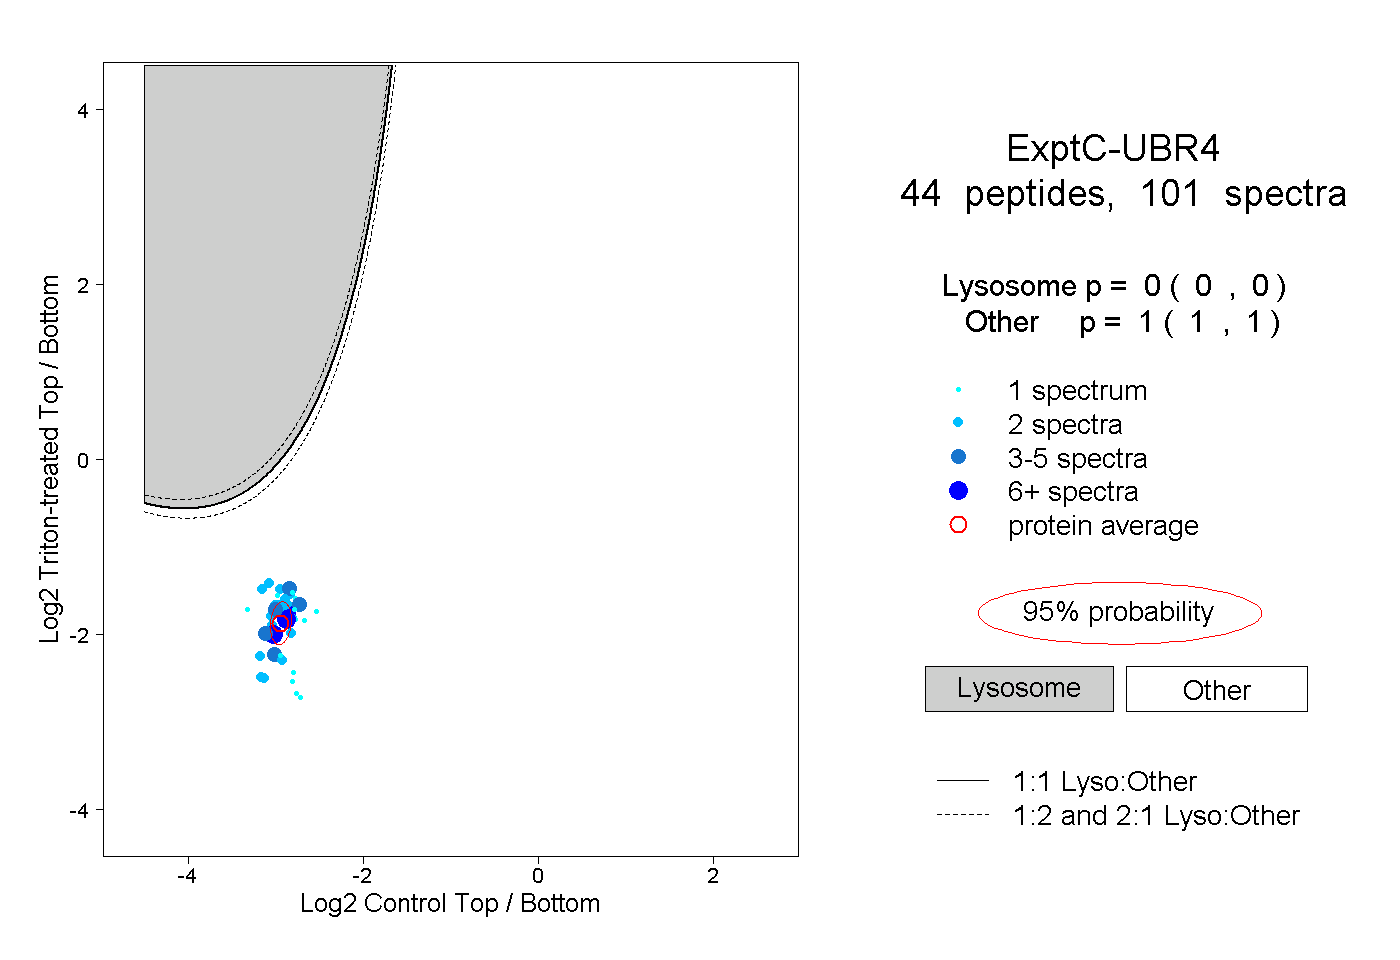
| Expt C |
44
peptides |
101
spectra |
 |
|
0.000
0.000 | 0.000 |
|
|
|
|
|
|
|
1.000
1.000 | 1.000 |
| | | Plot |
|
Lyso |
|
|
|
|
|
|
|
Other |
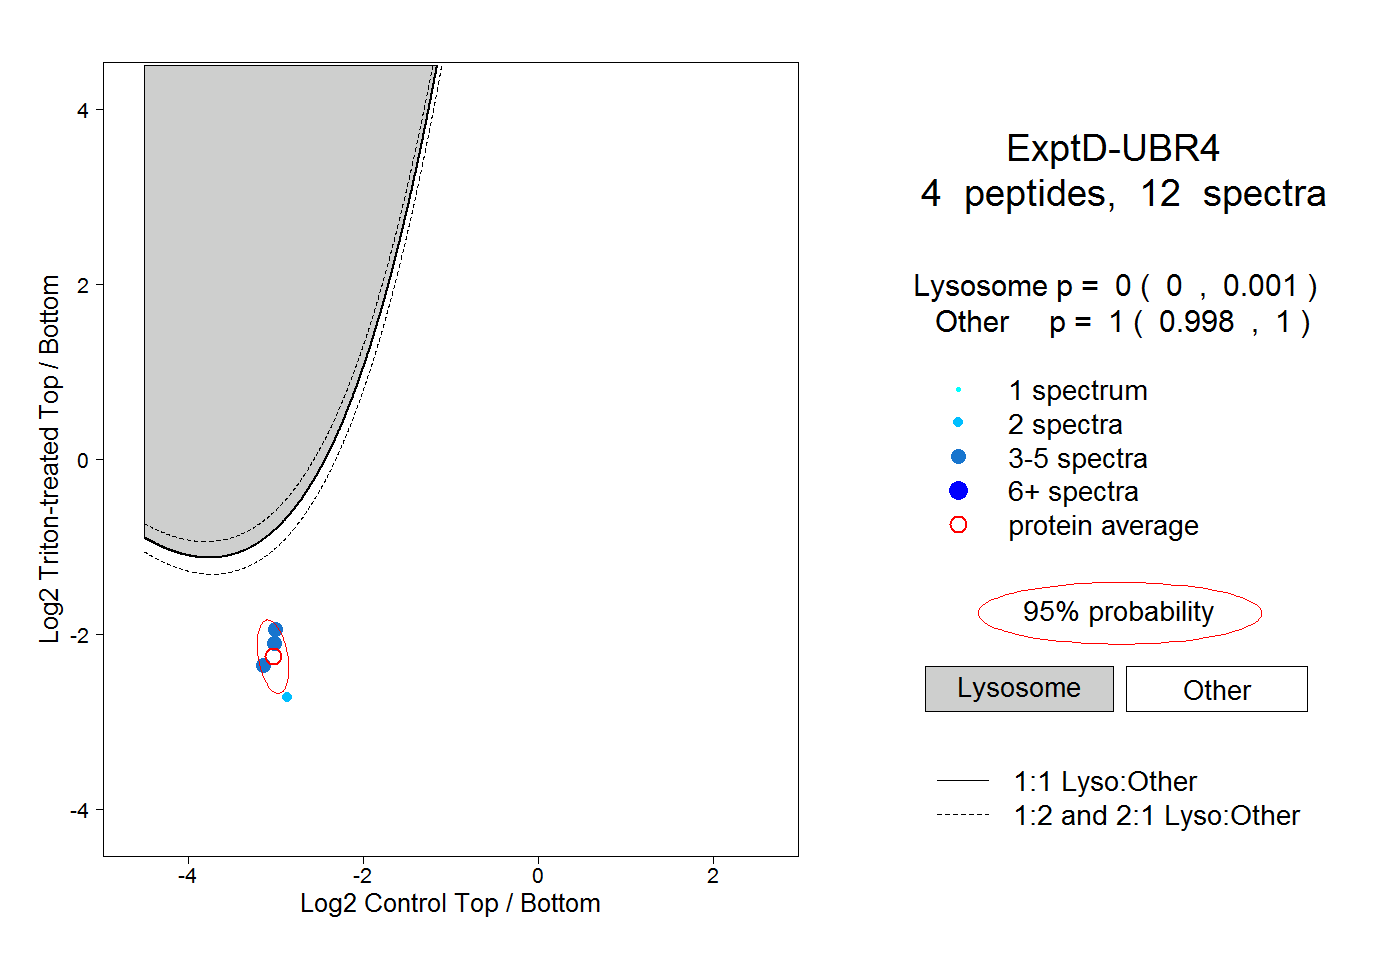
| Expt D |
4
peptides |
12
spectra |
 |
|
0.000
0.000 | 0.001 |
|
|
|
|
|
|
|
1.000
0.998 | 1.000 |