 6
6peptides
spectra
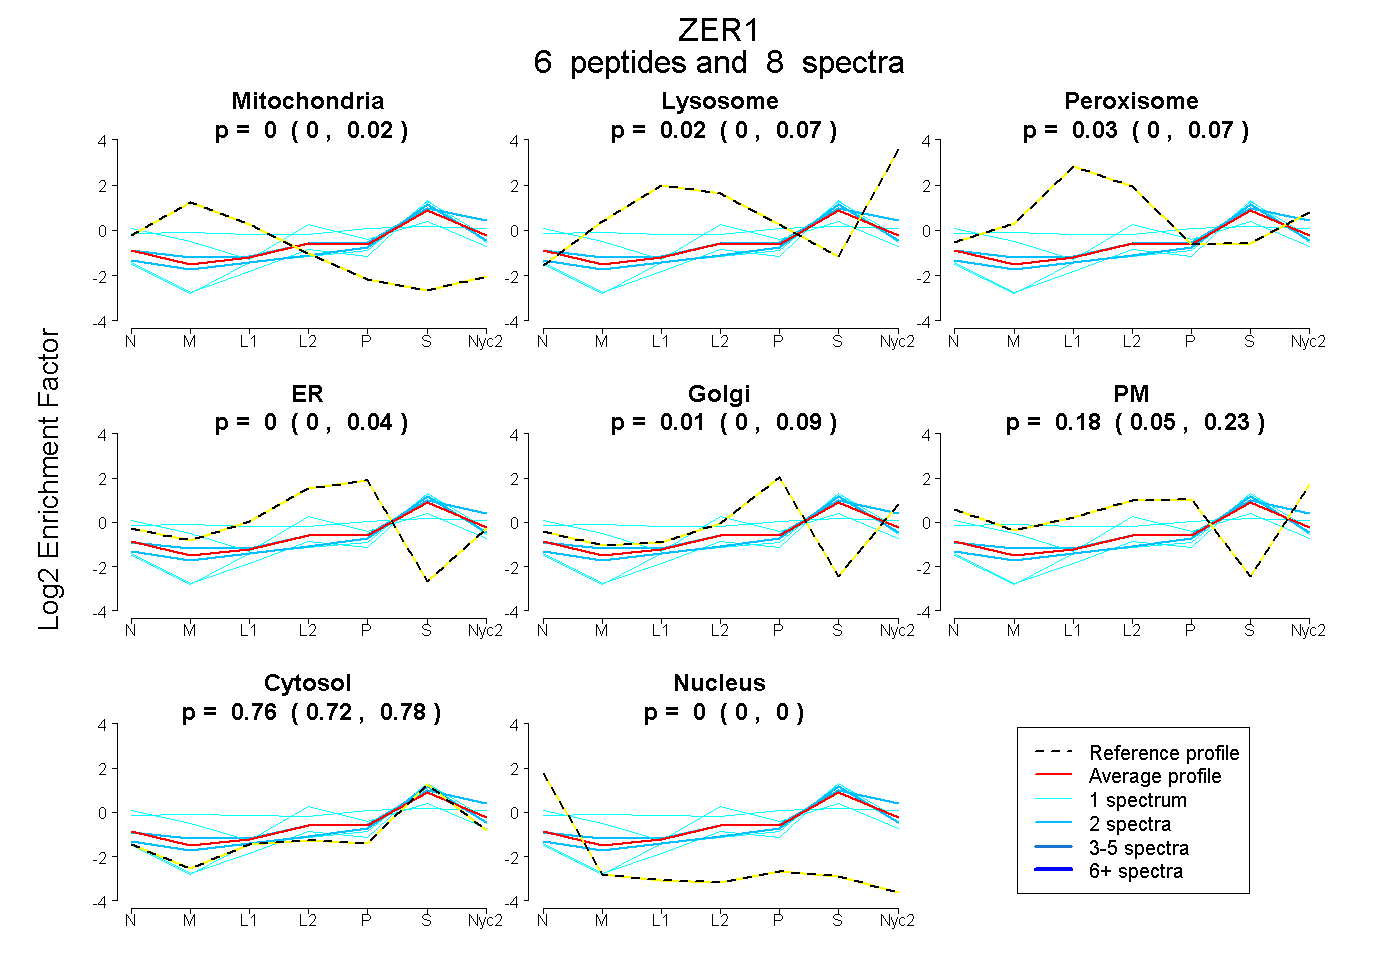
0.000 | 0.025
0.000 | 0.068
0.000 | 0.072
0.000 | 0.036
0.000 | 0.088
0.052 | 0.225
0.716 | 0.780
0.000 | 0.000
2peptides
spectra
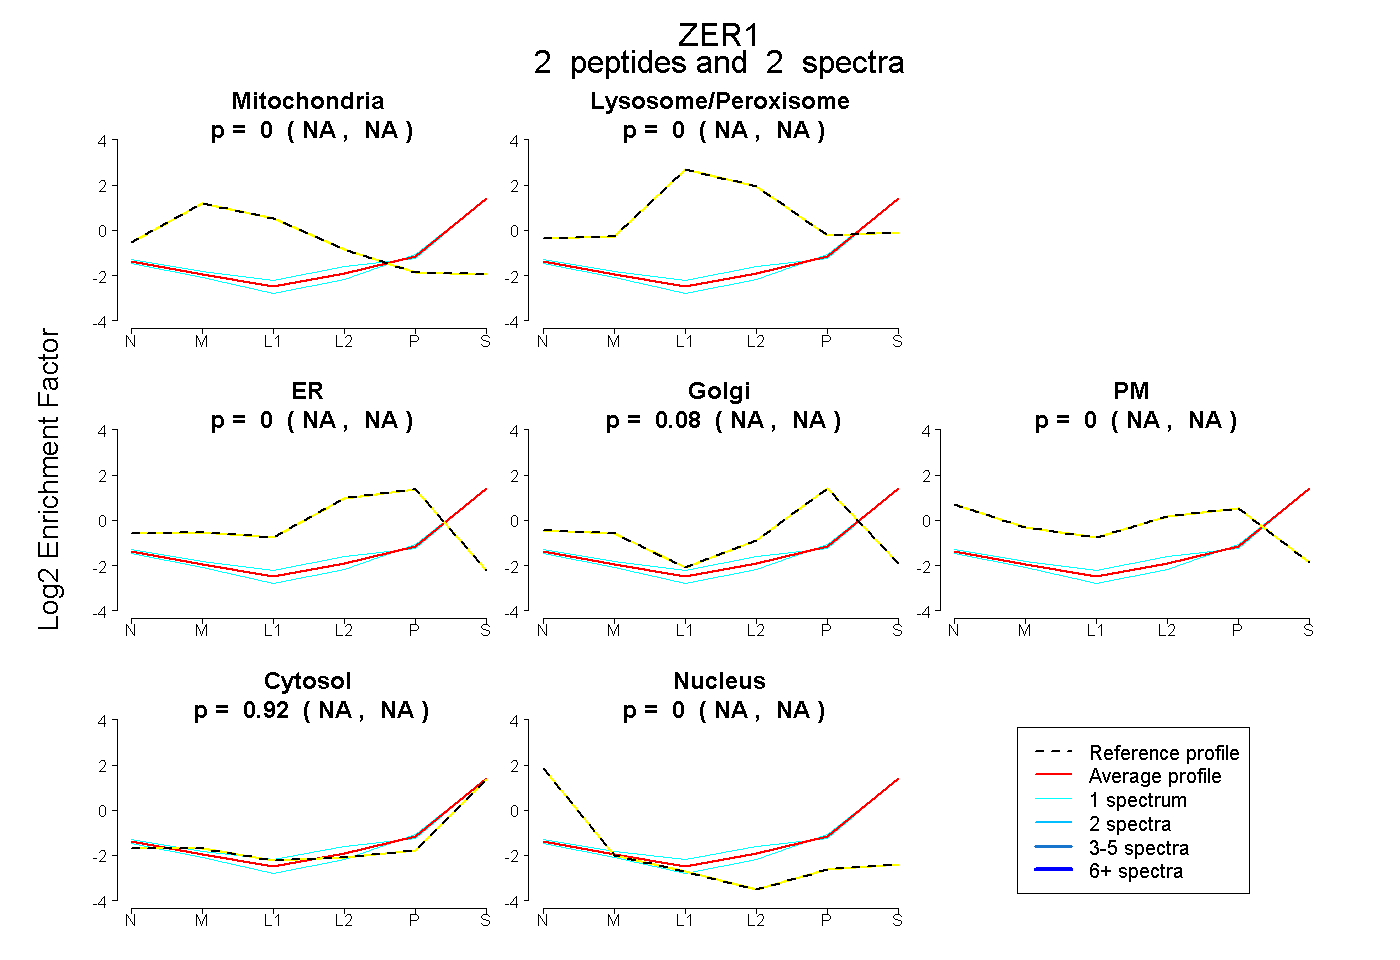
NA | NA
NA | NA
NA | NA
NA | NA
NA | NA
NA | NA
NA | NA
1peptide
spectra
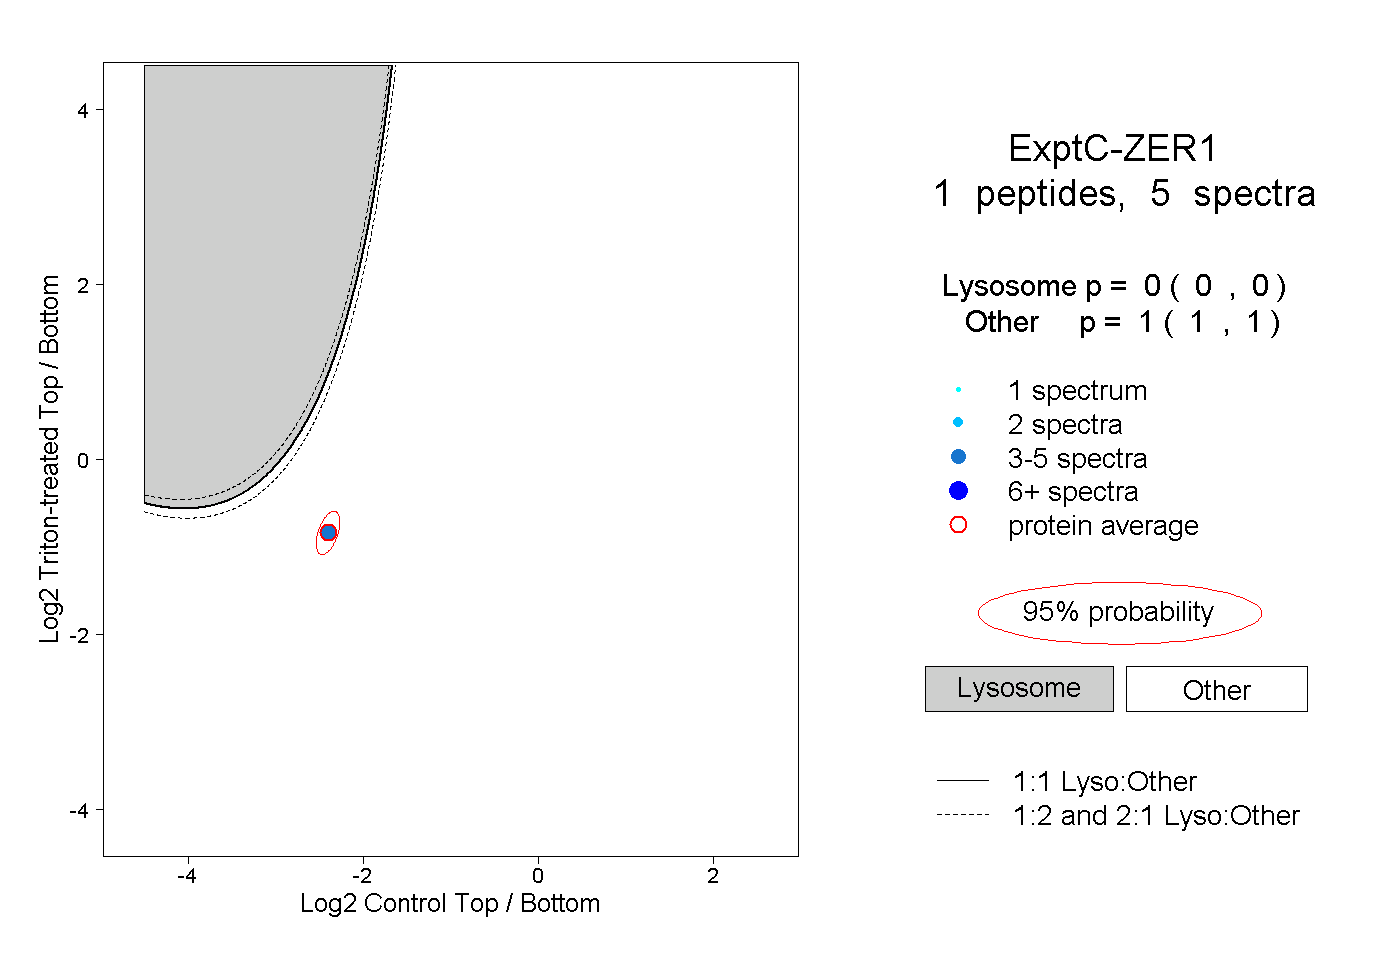
0.000 | 0.000
1.000 | 1.000