 6
6peptides
spectra
0.000 | 0.025
0.000 | 0.068
0.000 | 0.072
0.000 | 0.036
0.000 | 0.088
0.052 | 0.225
0.716 | 0.780
0.000 | 0.000
| Plot | Mito | Lyso | Perox | ER | Golgi | PM | Cytosol | Nucleus | |||||
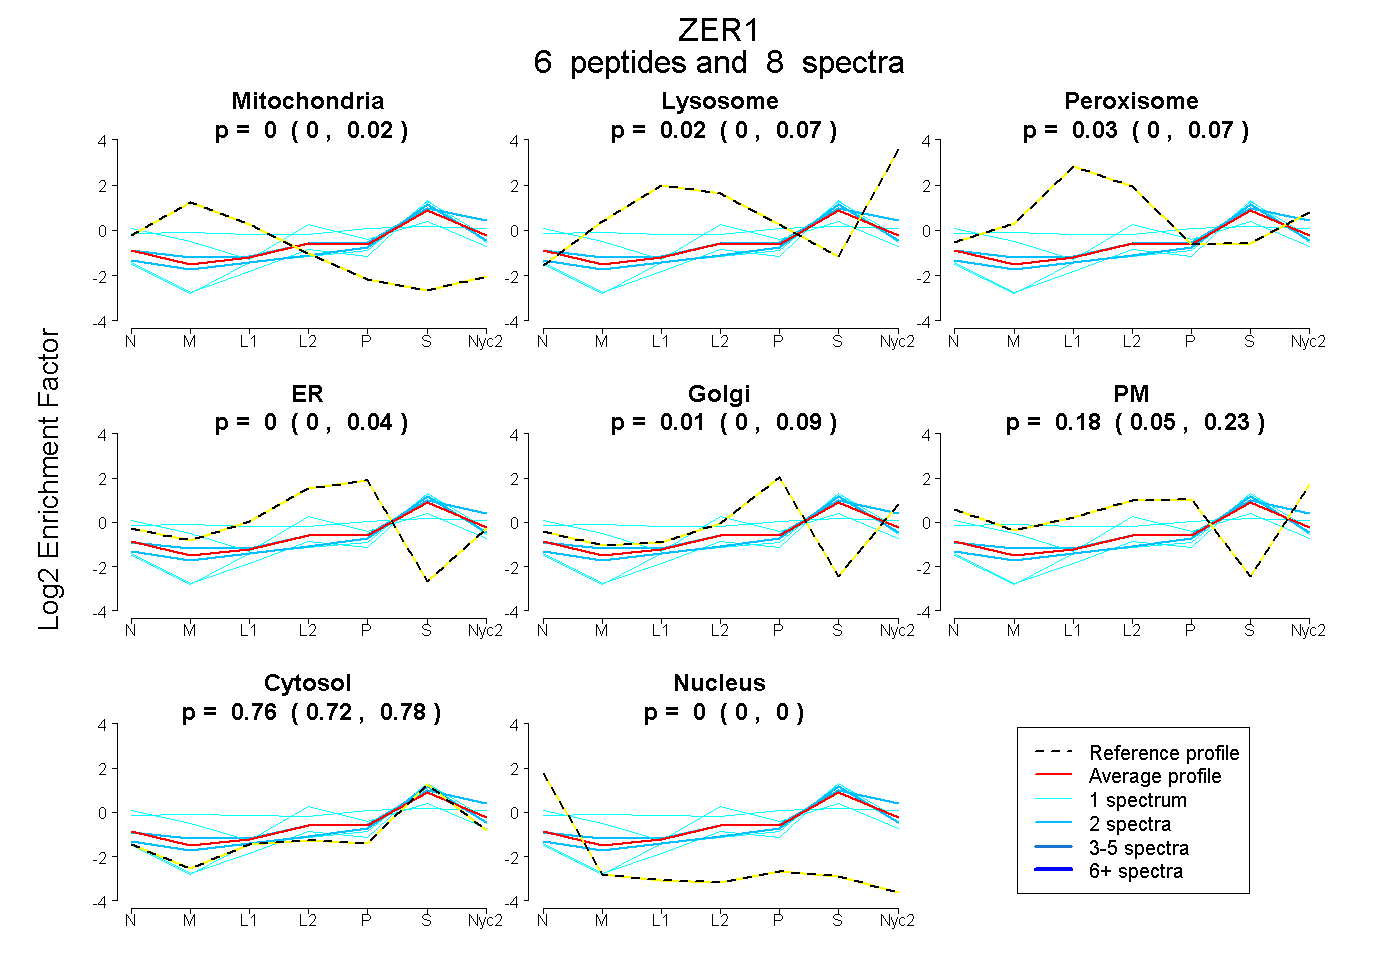
| Expt A |
6 peptides |
8 spectra |
|
0.000 0.000 | 0.025 |
0.017 0.000 | 0.068 |
0.031 0.000 | 0.072 |
0.000 0.000 | 0.036 |
0.011 0.000 | 0.088 |
0.184 0.052 | 0.225 |
0.757 0.716 | 0.780 |
0.000 0.000 | 0.000 |
| 2 spectra, VIVQLHK | 0.000 | 0.054 | 0.000 | 0.000 | 0.092 | 0.000 | 0.854 | 0.000 | ||
| 1 spectrum, EDLVQDQDLEAIR | 0.000 | 0.030 | 0.000 | 0.000 | 0.038 | 0.000 | 0.932 | 0.000 | ||
| 1 spectrum, MGFVVTMLK | 0.086 | 0.000 | 0.228 | 0.000 | 0.107 | 0.201 | 0.378 | 0.000 | ||
| 1 spectrum, TDEEAGQTSTEPSK | 0.119 | 0.000 | 0.038 | 0.139 | 0.000 | 0.179 | 0.525 | 0.000 | ||
| 2 spectra, FLNLGR | 0.000 | 0.153 | 0.000 | 0.000 | 0.000 | 0.135 | 0.711 | 0.000 | ||
| 1 spectrum, AINLLFDIAR | 0.000 | 0.000 | 0.000 | 0.000 | 0.036 | 0.000 | 0.964 | 0.000 |
| Plot | Mito | Lyso or Perox | ER | Golgi | PM | Cytosol | Nucleus | ||||||
| Expt B |
2 peptides |
2 spectra |
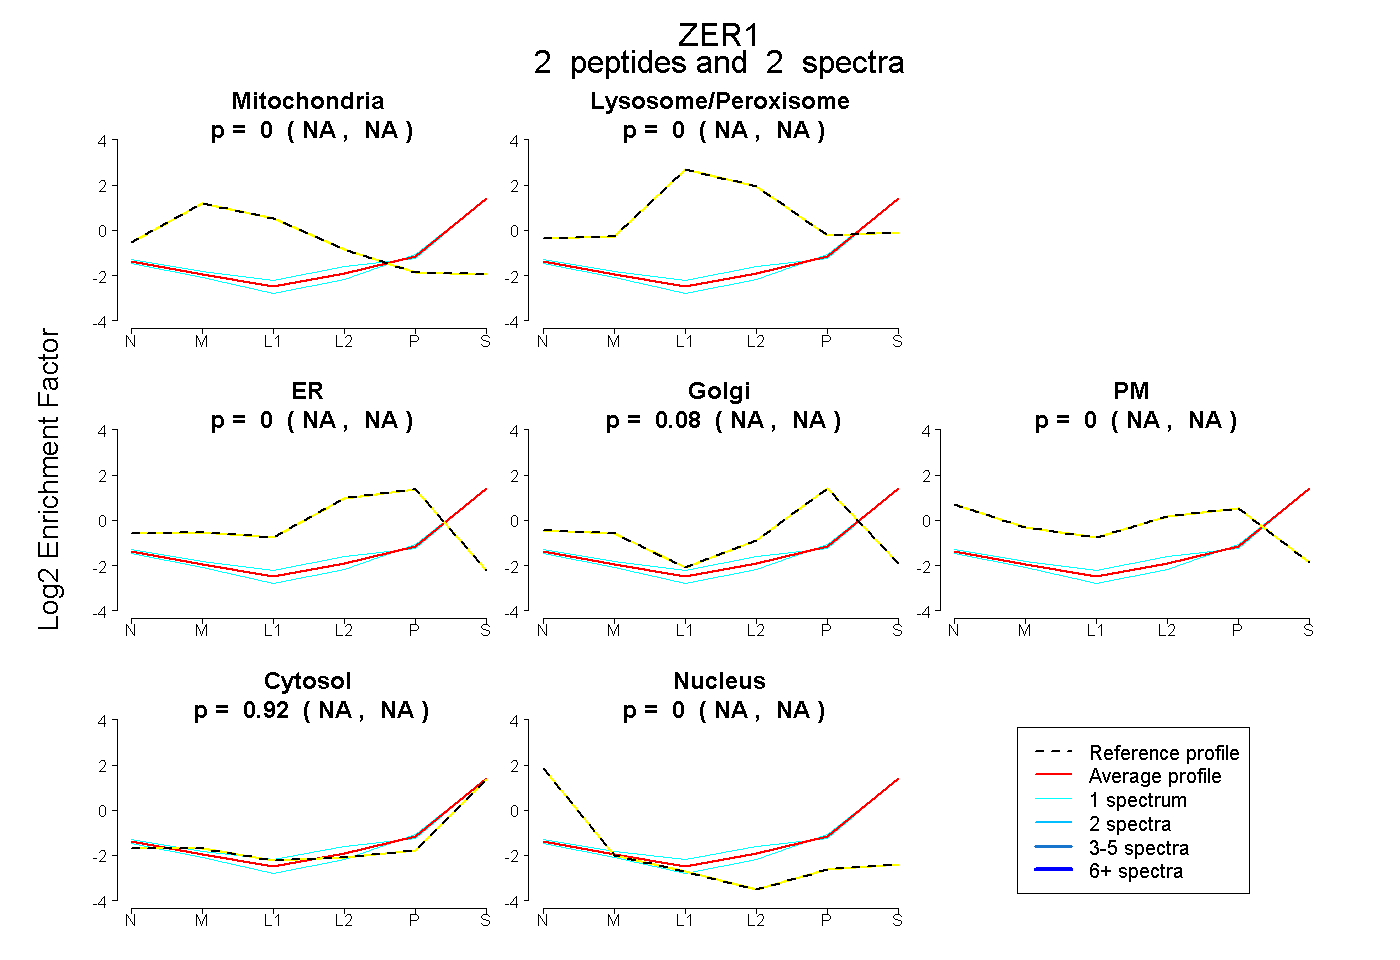 |
0.000 NA | NA |
0.000 NA | NA |
0.000 NA | NA |
0.082 NA | NA |
0.000 NA | NA |
0.918 NA | NA |
0.000 NA | NA |
|||
| Plot | Lyso | Other | |||||||||||
| Expt C |
1 peptide |
5 spectra |
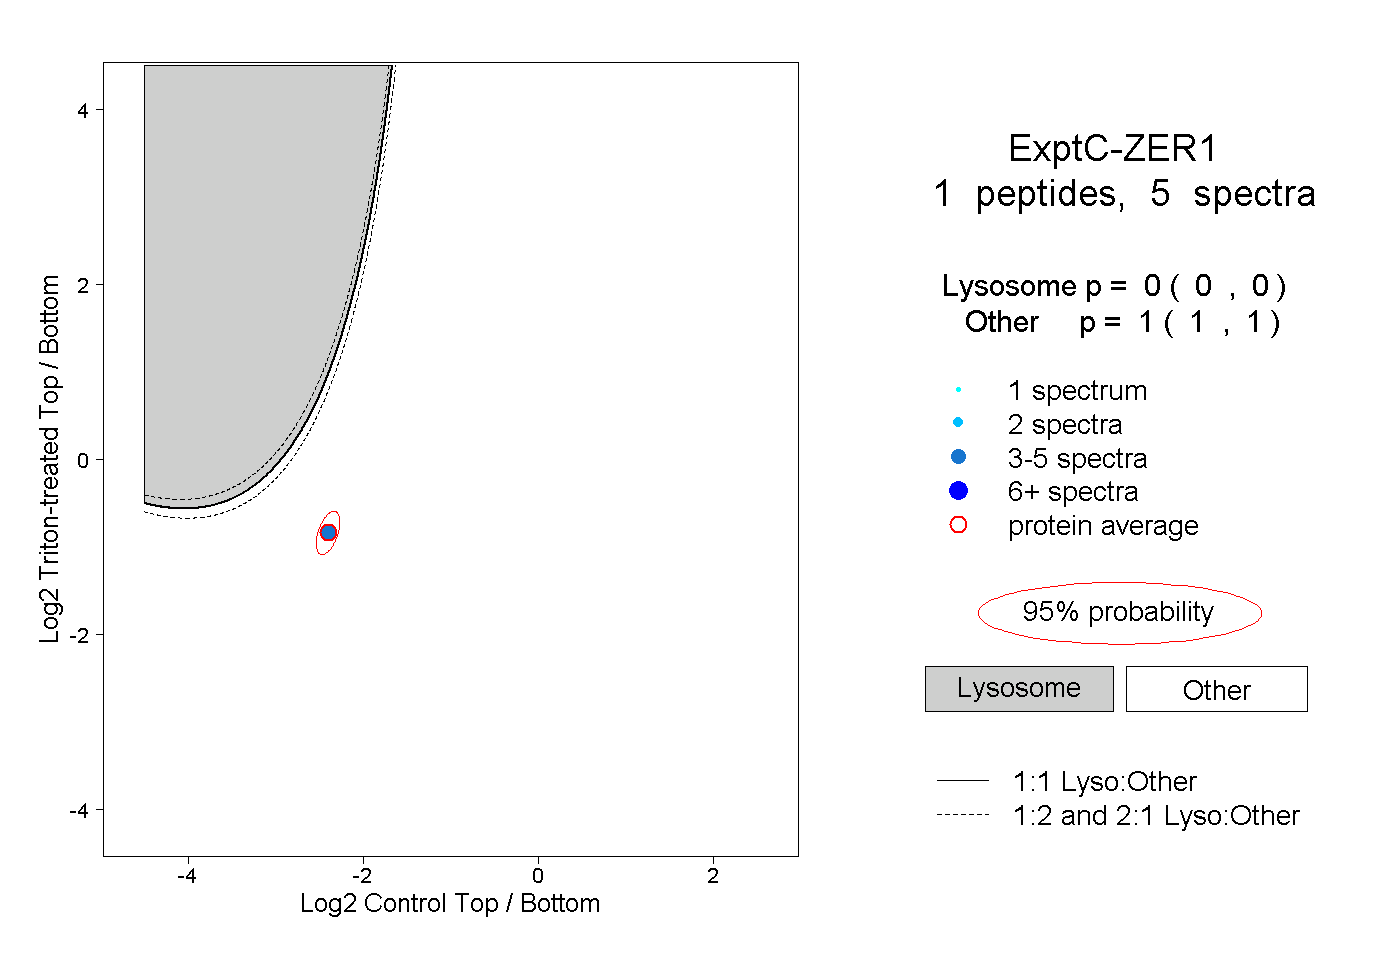 |
0.000 0.000 | 0.000 |
1.000 1.000 | 1.000 |