 3
3peptides
spectra
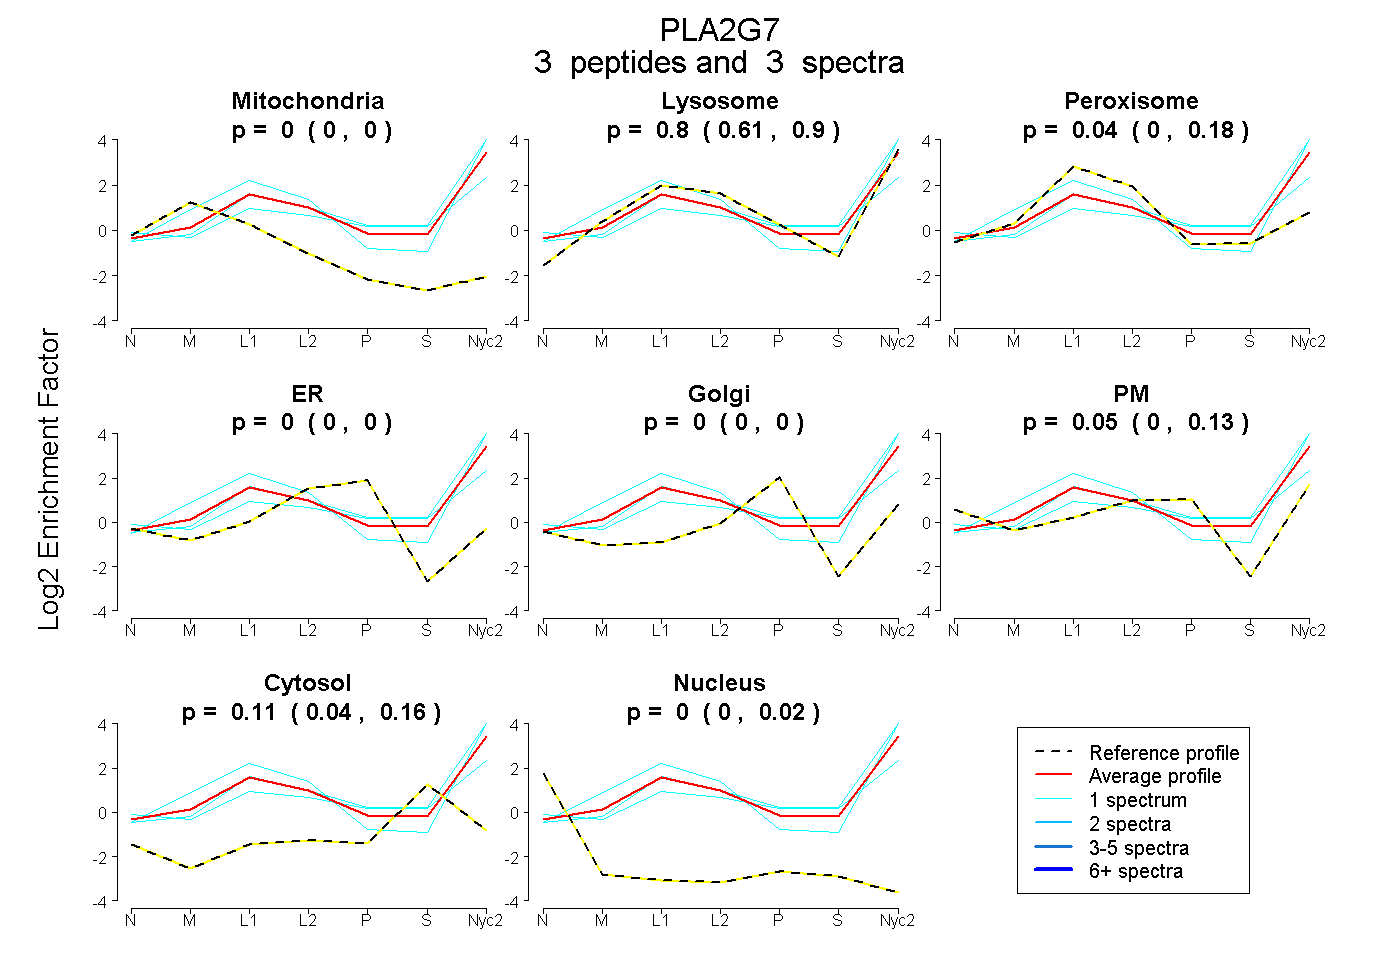
0.000 | 0.000
0.612 | 0.901
0.000 | 0.175
0.000 | 0.000
0.000 | 0.000
0.000 | 0.128
0.039 | 0.160
0.000 | 0.024
2peptides
spectra
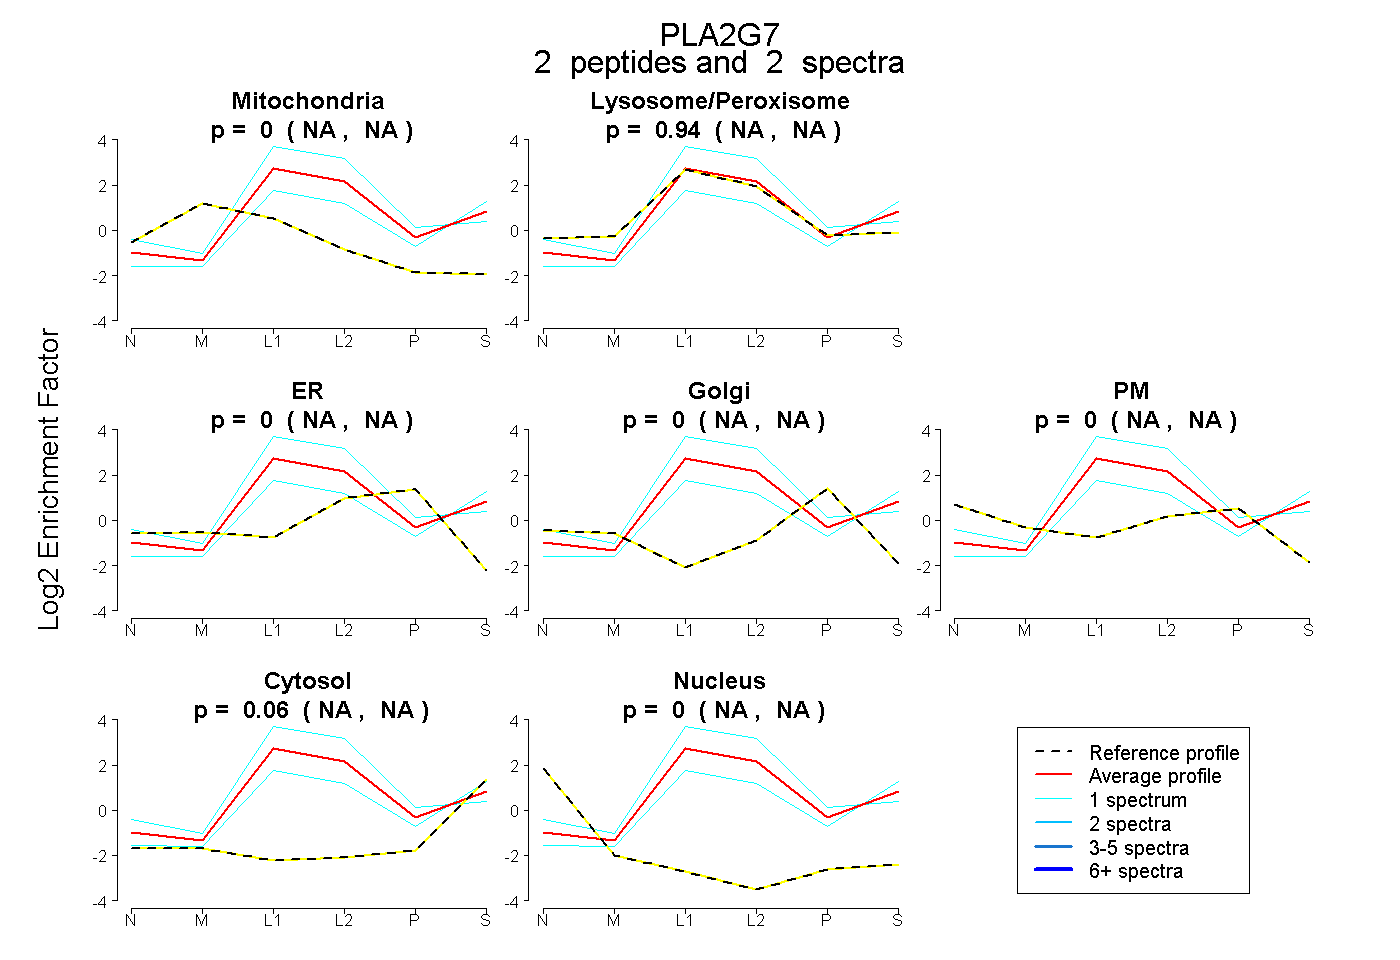
NA | NA
NA | NA
NA | NA
NA | NA
NA | NA
NA | NA
NA | NA
9peptides
spectra
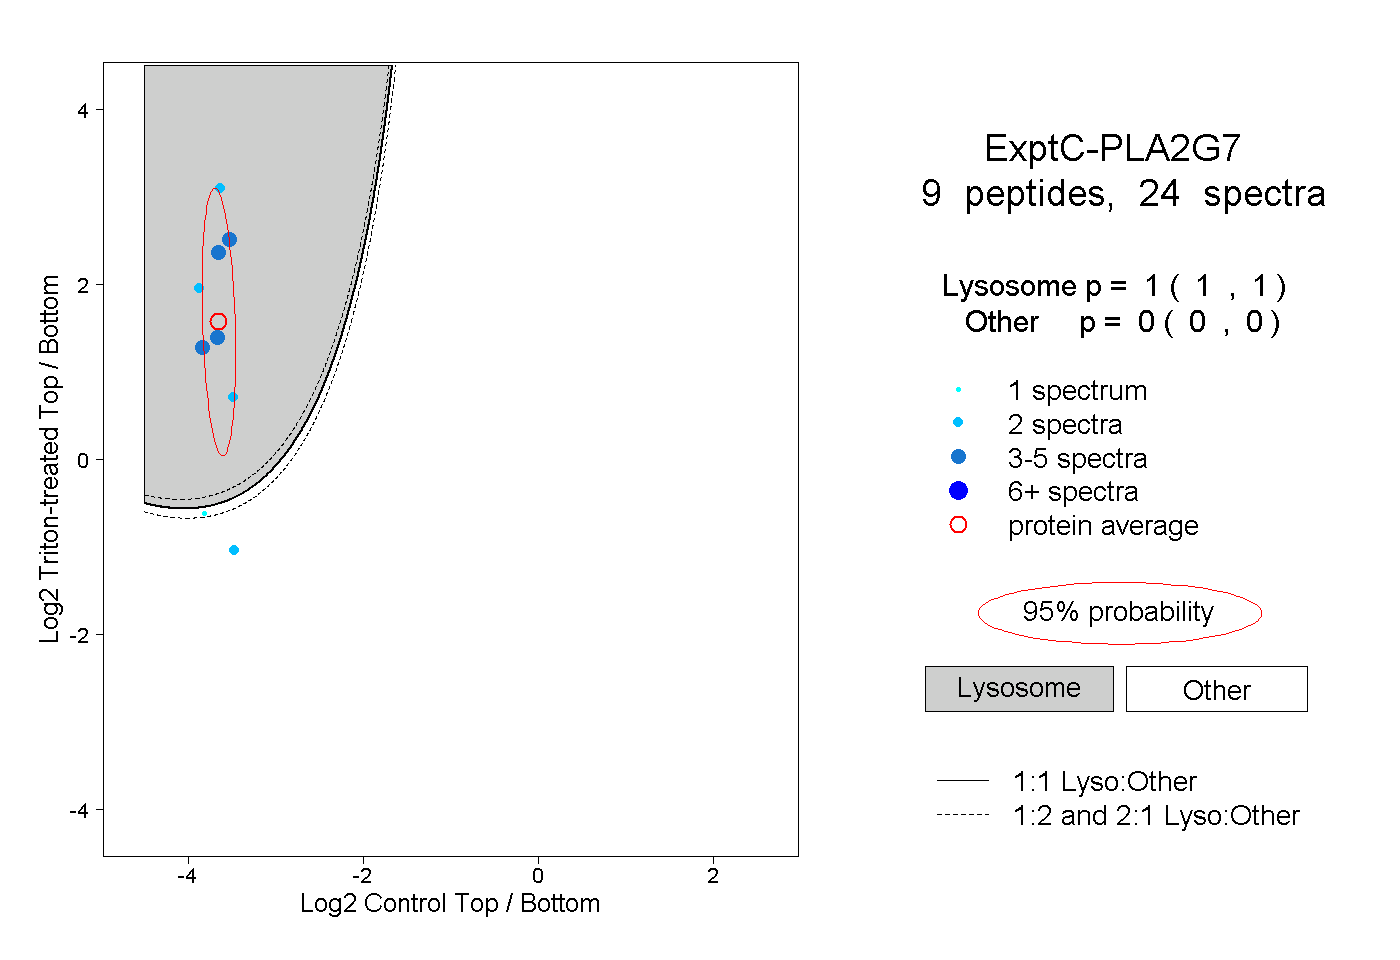
1.000 | 1.000
0.000 | 0.000