 3
3peptides
spectra
0.000 | 0.000
0.612 | 0.901
0.000 | 0.175
0.000 | 0.000
0.000 | 0.000
0.000 | 0.128
0.039 | 0.160
0.000 | 0.024
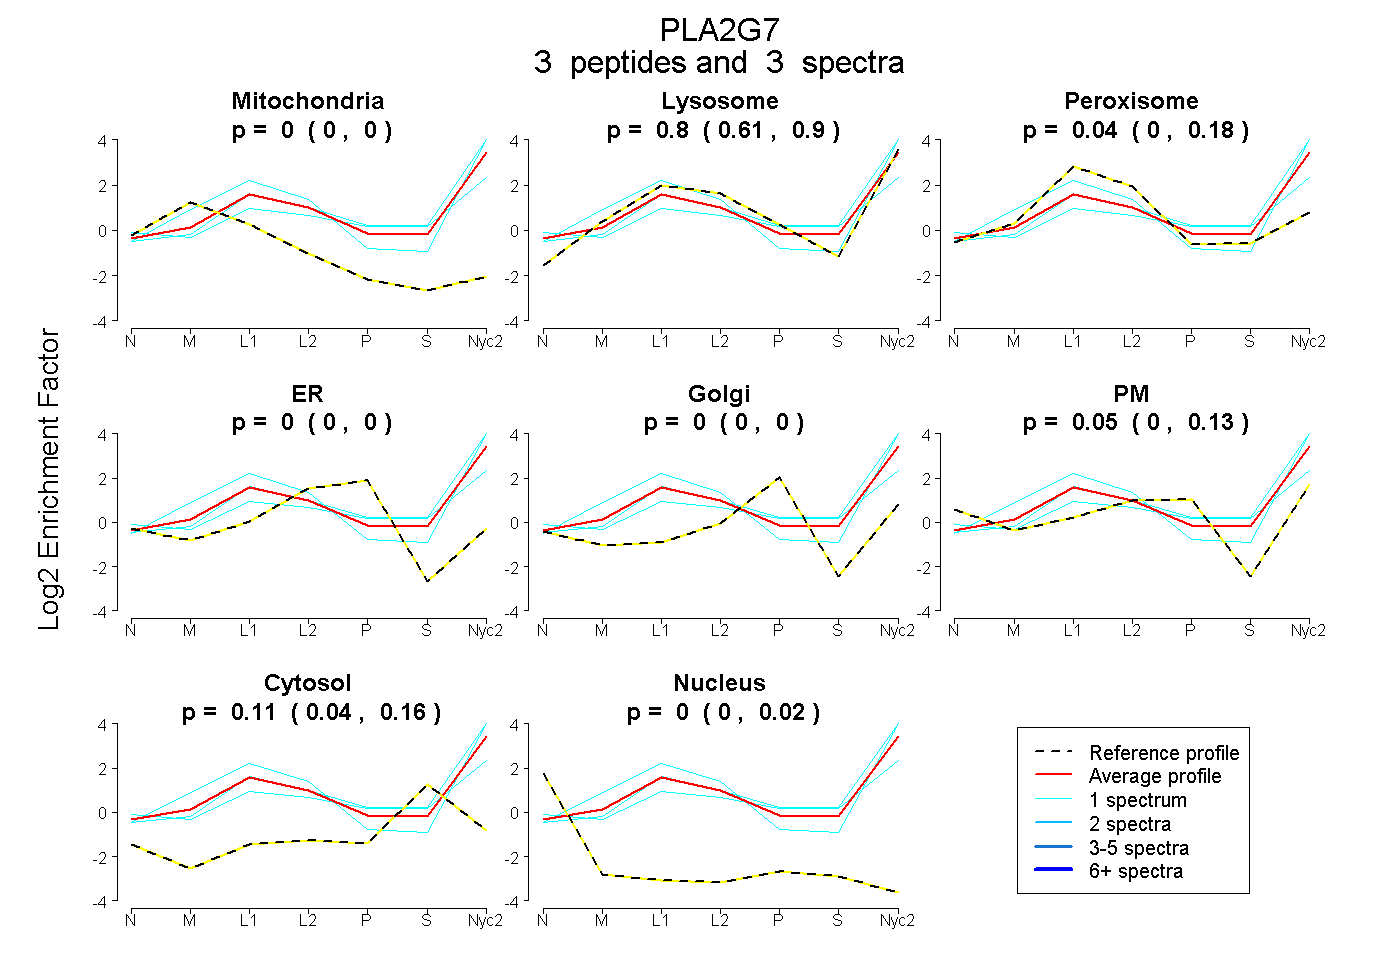
| Plot | Mito | Lyso | Perox | ER | Golgi | PM | Cytosol | Nucleus | |||||
| Expt A |
3 peptides |
3 spectra |
|
0.000 0.000 | 0.000 |
0.801 0.612 | 0.901 |
0.037 0.000 | 0.175 |
0.000 0.000 | 0.000 |
0.000 0.000 | 0.000 |
0.047 0.000 | 0.128 |
0.115 0.039 | 0.160 |
0.000 0.000 | 0.024 |
| 1 spectrum, ASLAFLQK | 0.018 | 0.917 | 0.065 | 0.000 | 0.000 | 0.000 | 0.000 | 0.000 | ||
| 1 spectrum, GSVHQNFADGTFVTGK | 0.000 | 0.474 | 0.094 | 0.000 | 0.000 | 0.193 | 0.239 | 0.000 | ||
| 1 spectrum, FLGTPTFVGNILR | 0.000 | 0.886 | 0.000 | 0.000 | 0.000 | 0.000 | 0.114 | 0.000 |
| Plot | Mito | Lyso or Perox | ER | Golgi | PM | Cytosol | Nucleus | ||||||
| Expt B |
2 peptides |
2 spectra |
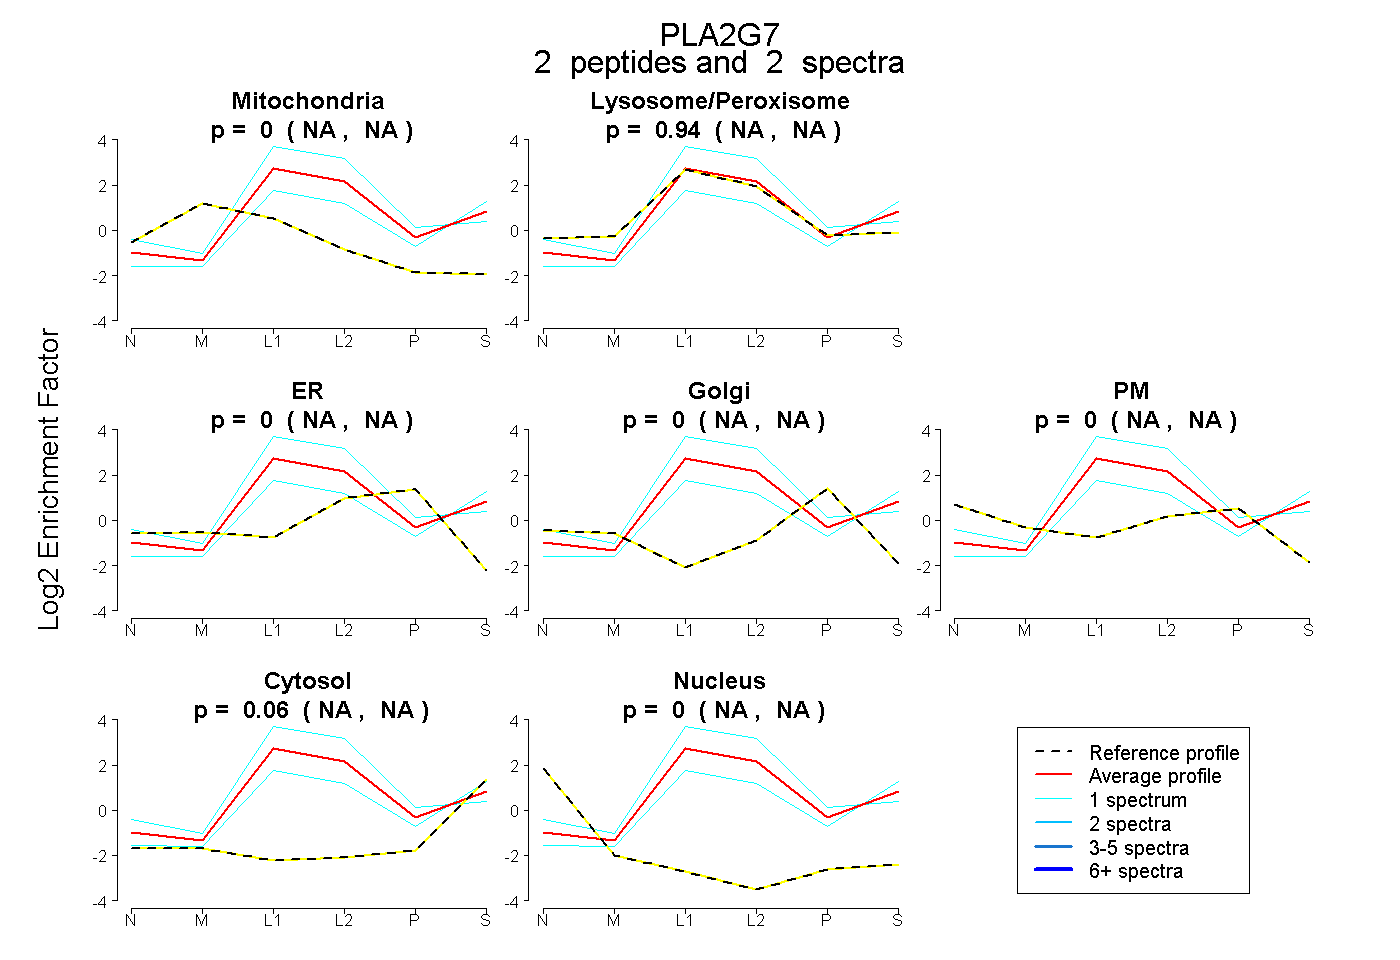 |
0.000 NA | NA |
0.943 NA | NA |
0.000 NA | NA |
0.000 NA | NA |
0.000 NA | NA |
0.057 NA | NA |
0.000 NA | NA |
|||
| Plot | Lyso | Other | |||||||||||
| Expt C |
9 peptides |
24 spectra |
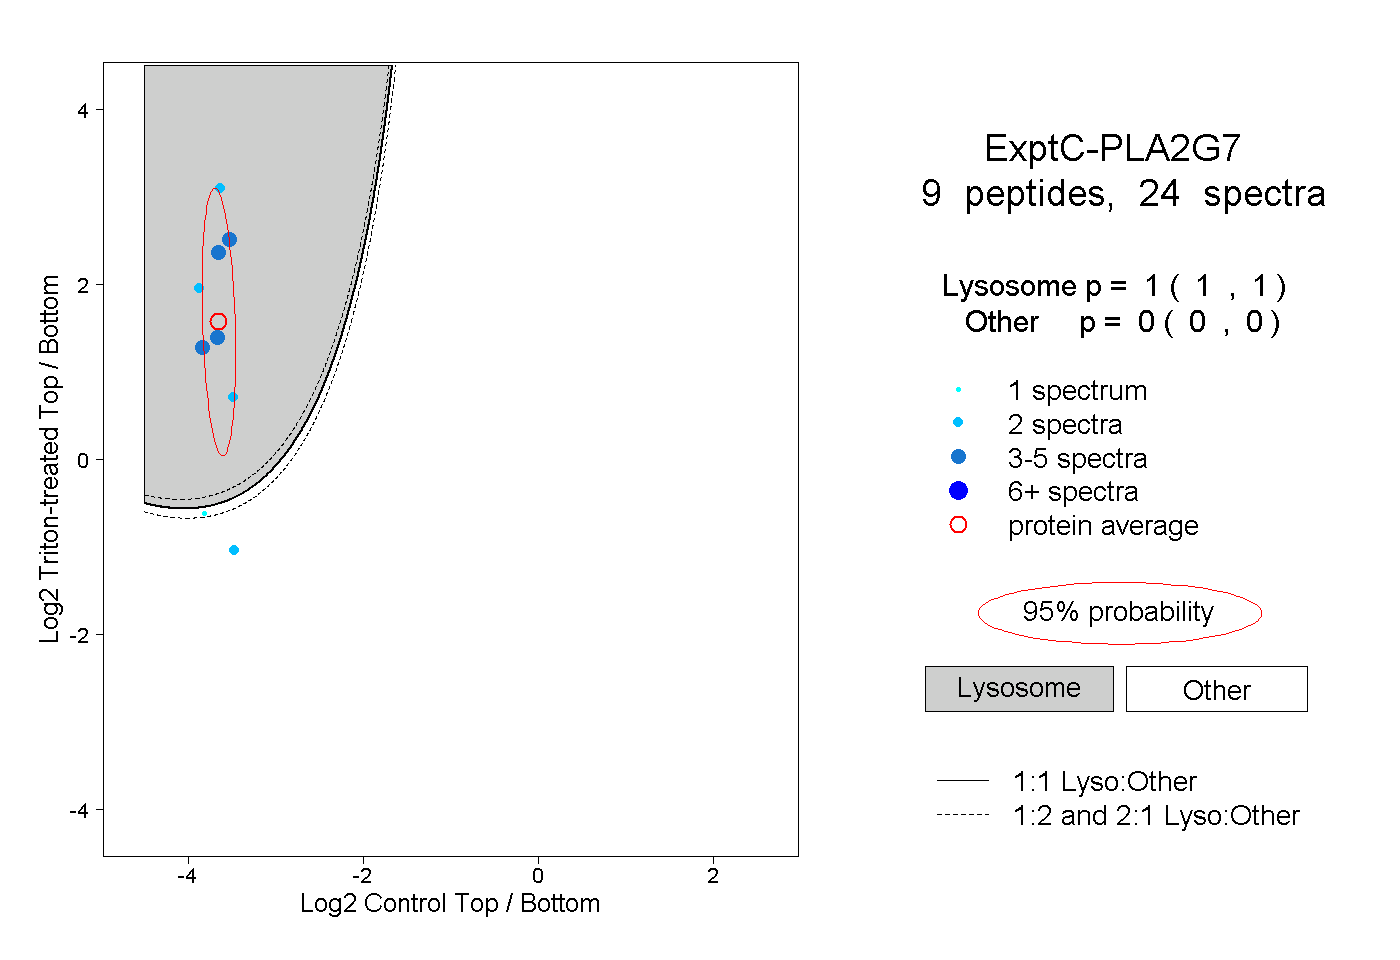 |
1.000 1.000 | 1.000 |
0.000 0.000 | 0.000 |