 4
4peptides
spectra

0.033 | 0.249
0.245 | 0.478
0.000 | 0.039
0.000 | 0.000
0.000 | 0.065
0.000 | 0.173
0.198 | 0.489
0.000 | 0.122
1peptide
spectrum
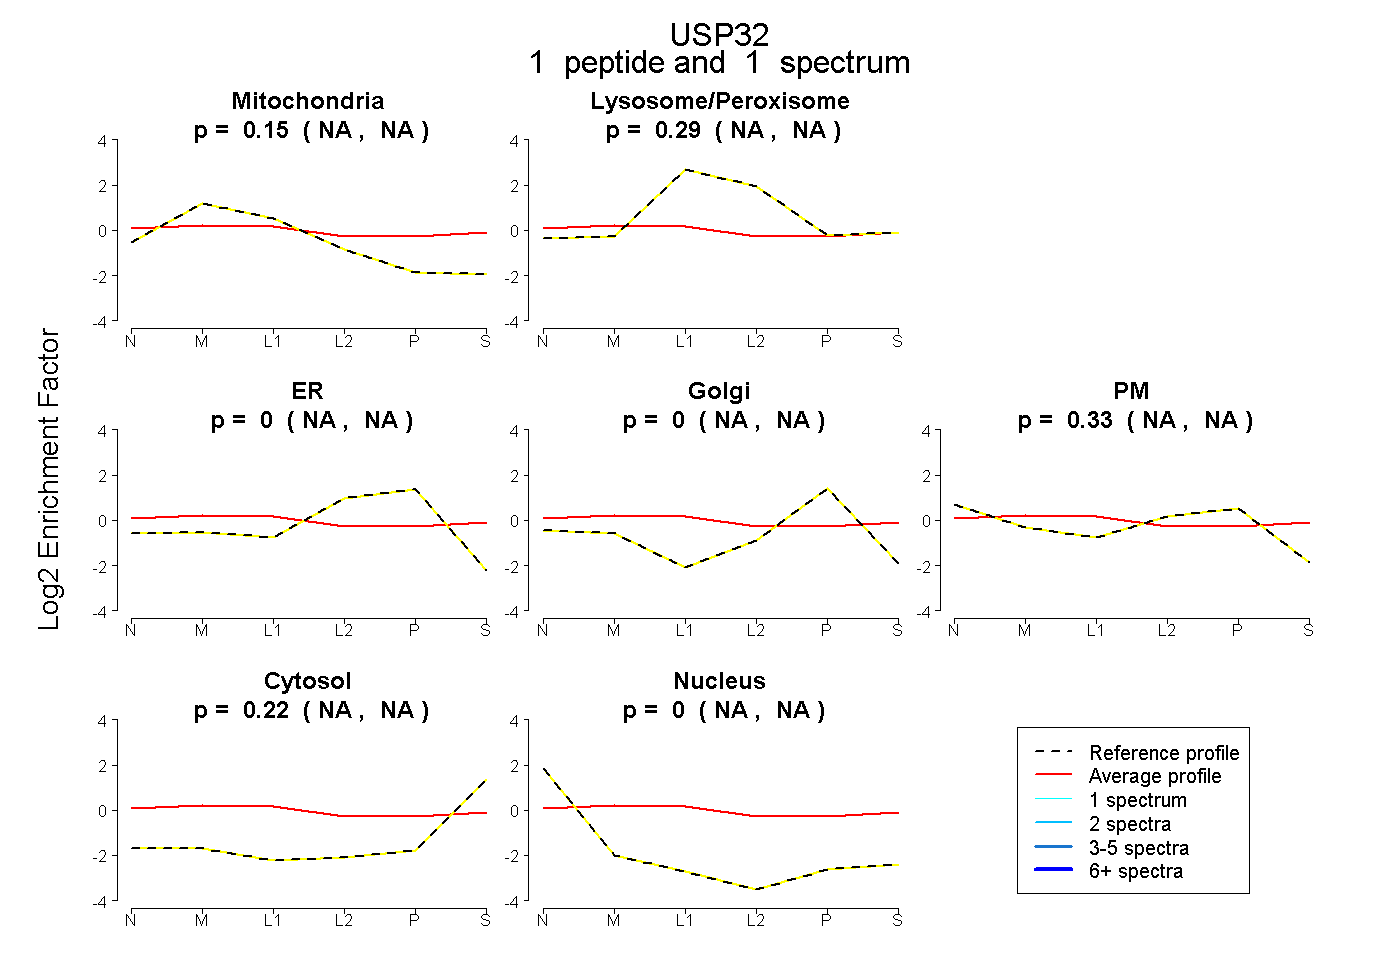
NA | NA
NA | NA
NA | NA
NA | NA
NA | NA
NA | NA
NA | NA
3peptides
spectra
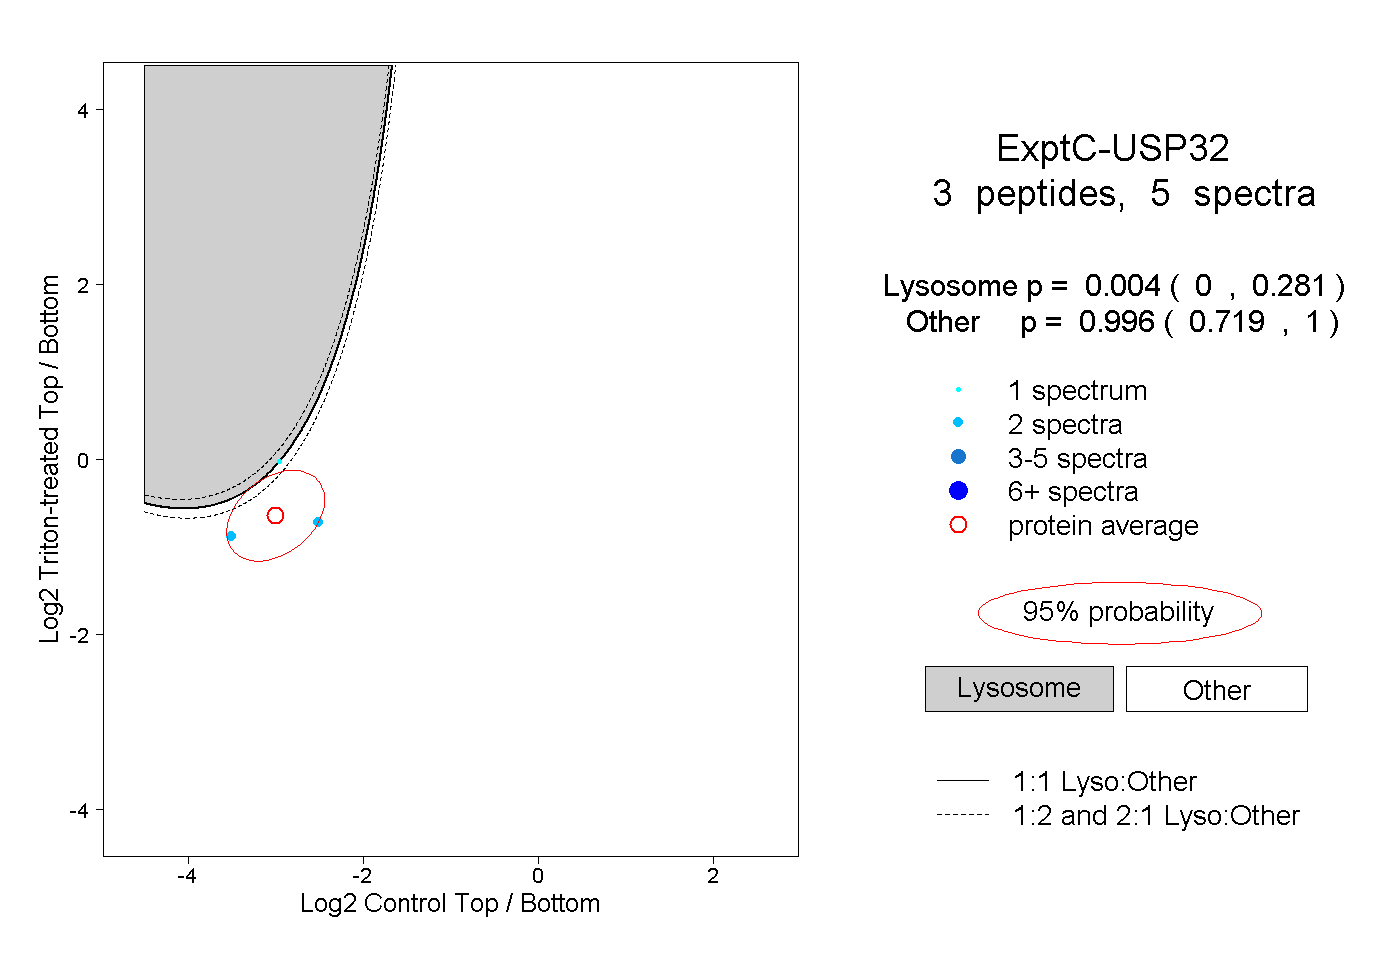
0.000 | 0.281
0.719 | 1.000