 4
4peptides
spectra

0.033 | 0.249
0.245 | 0.478
0.000 | 0.039
0.000 | 0.000
0.000 | 0.065
0.000 | 0.173
0.198 | 0.489
0.000 | 0.122
| Plot | Mito | Lyso | Perox | ER | Golgi | PM | Cytosol | Nucleus | |||||
| Expt A |
4 peptides |
5 spectra |
|
0.165 0.033 | 0.249 |
0.343 0.245 | 0.478 |
0.000 0.000 | 0.039 |
0.000 0.000 | 0.000 |
0.000 0.000 | 0.065 |
0.094 0.000 | 0.173 |
0.399 0.198 | 0.489 |
0.000 0.000 | 0.122 |
| 1 spectrum, YLLFLR | 0.826 | 0.054 | 0.000 | 0.000 | 0.000 | 0.120 | 0.000 | 0.000 | ||
| 1 spectrum, VFDIDR | 0.000 | 0.405 | 0.000 | 0.000 | 0.000 | 0.020 | 0.576 | 0.000 | ||
| 1 spectrum, FQFVNGR | 0.000 | 0.428 | 0.005 | 0.000 | 0.000 | 0.078 | 0.489 | 0.000 | ||
| 2 spectra, SIVVDLFHGQLR | 0.000 | 0.477 | 0.000 | 0.000 | 0.000 | 0.000 | 0.523 | 0.000 |
| Plot | Mito | Lyso or Perox | ER | Golgi | PM | Cytosol | Nucleus | ||||||
| Expt B |
1 peptide |
1 spectrum |
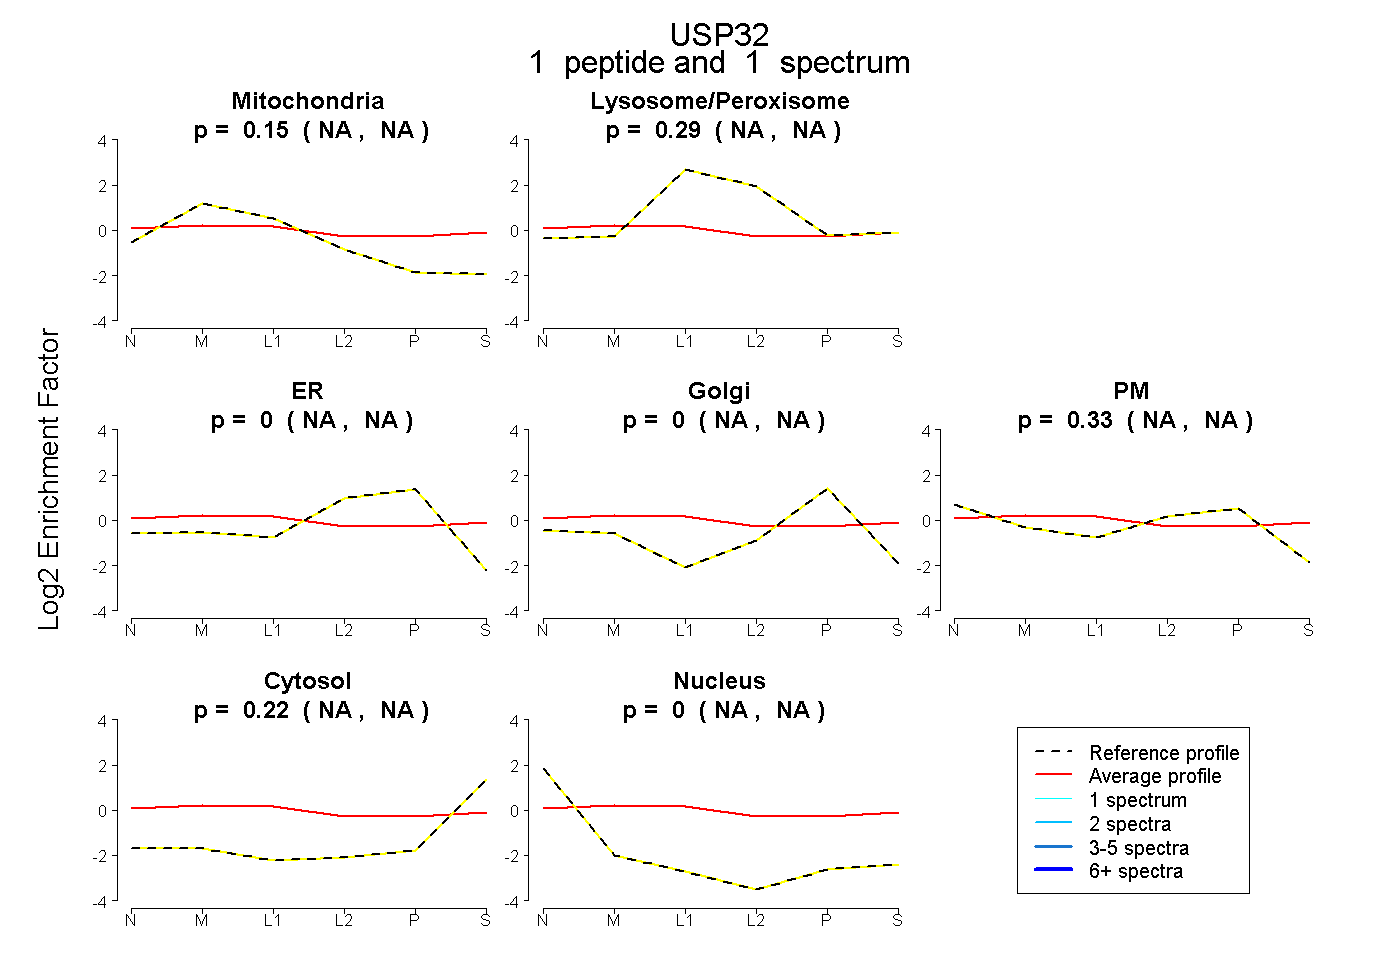 |
0.154 NA | NA |
0.289 NA | NA |
0.000 NA | NA |
0.000 NA | NA |
0.332 NA | NA |
0.225 NA | NA |
0.000 NA | NA |
|||
| Plot | Lyso | Other | |||||||||||
| Expt C |
3 peptides |
5 spectra |
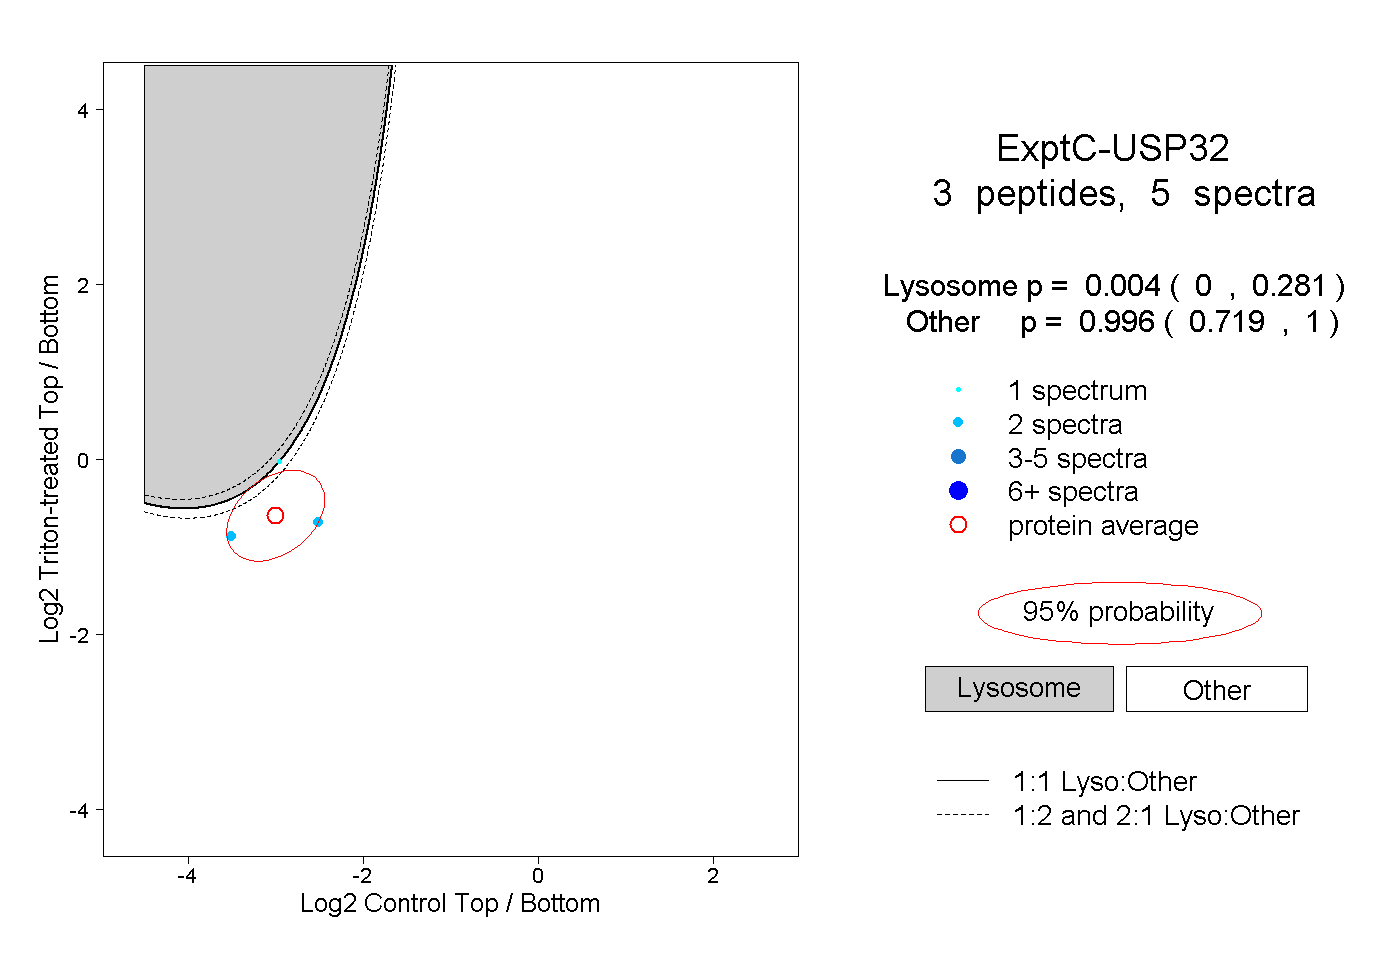 |
0.004 0.000 | 0.281 |
0.996 0.719 | 1.000 |