 20
20peptides
spectra
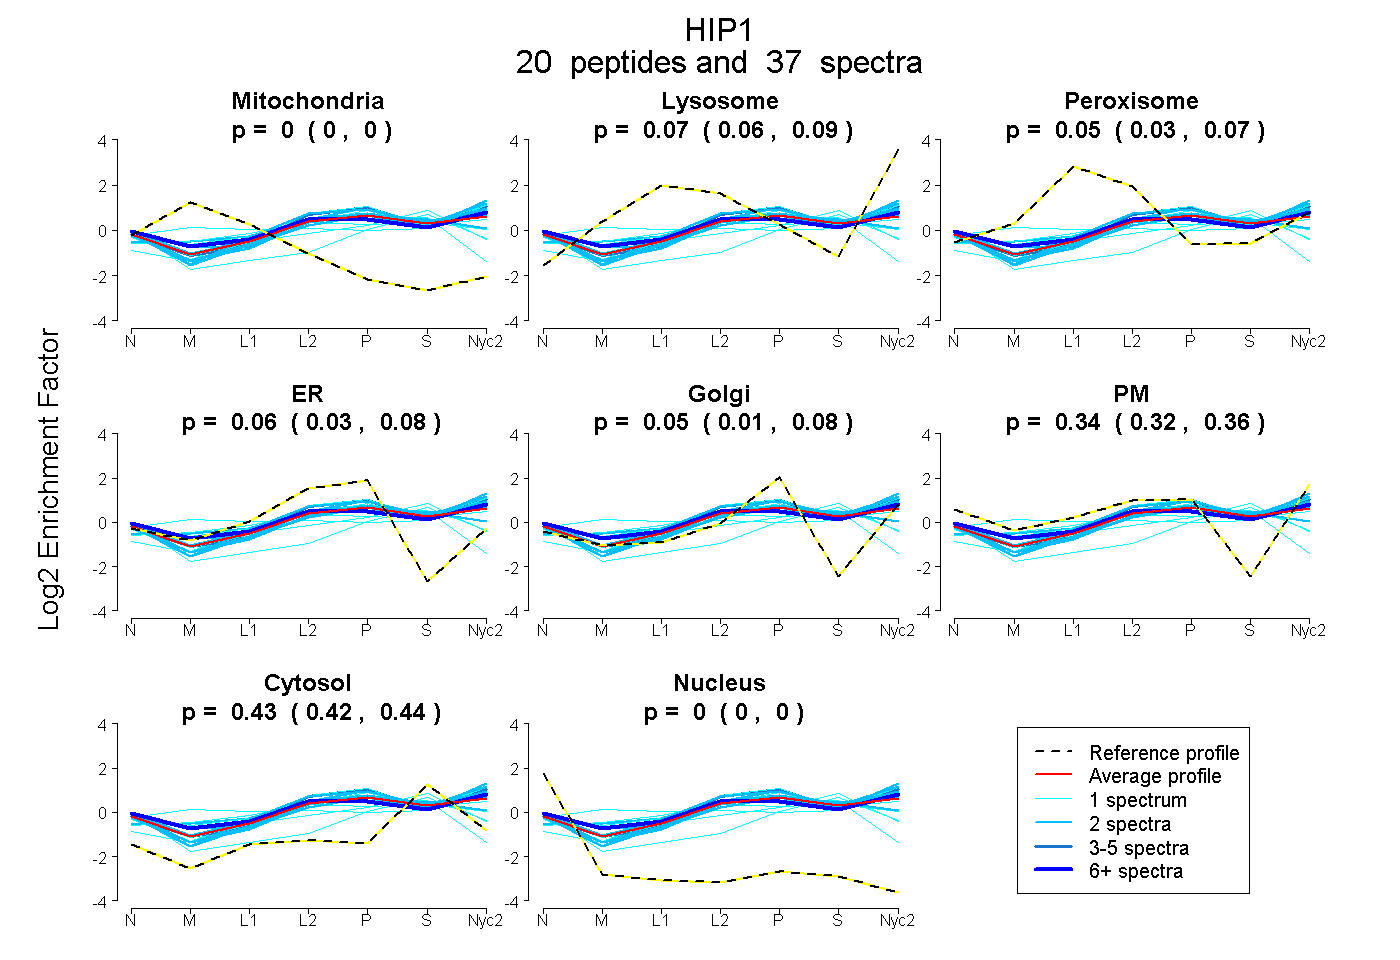
0.000 | 0.000
0.055 | 0.085
0.027 | 0.070
0.034 | 0.077
0.013 | 0.076
0.321 | 0.357
0.425 | 0.438
0.000 | 0.000
4peptides
spectra
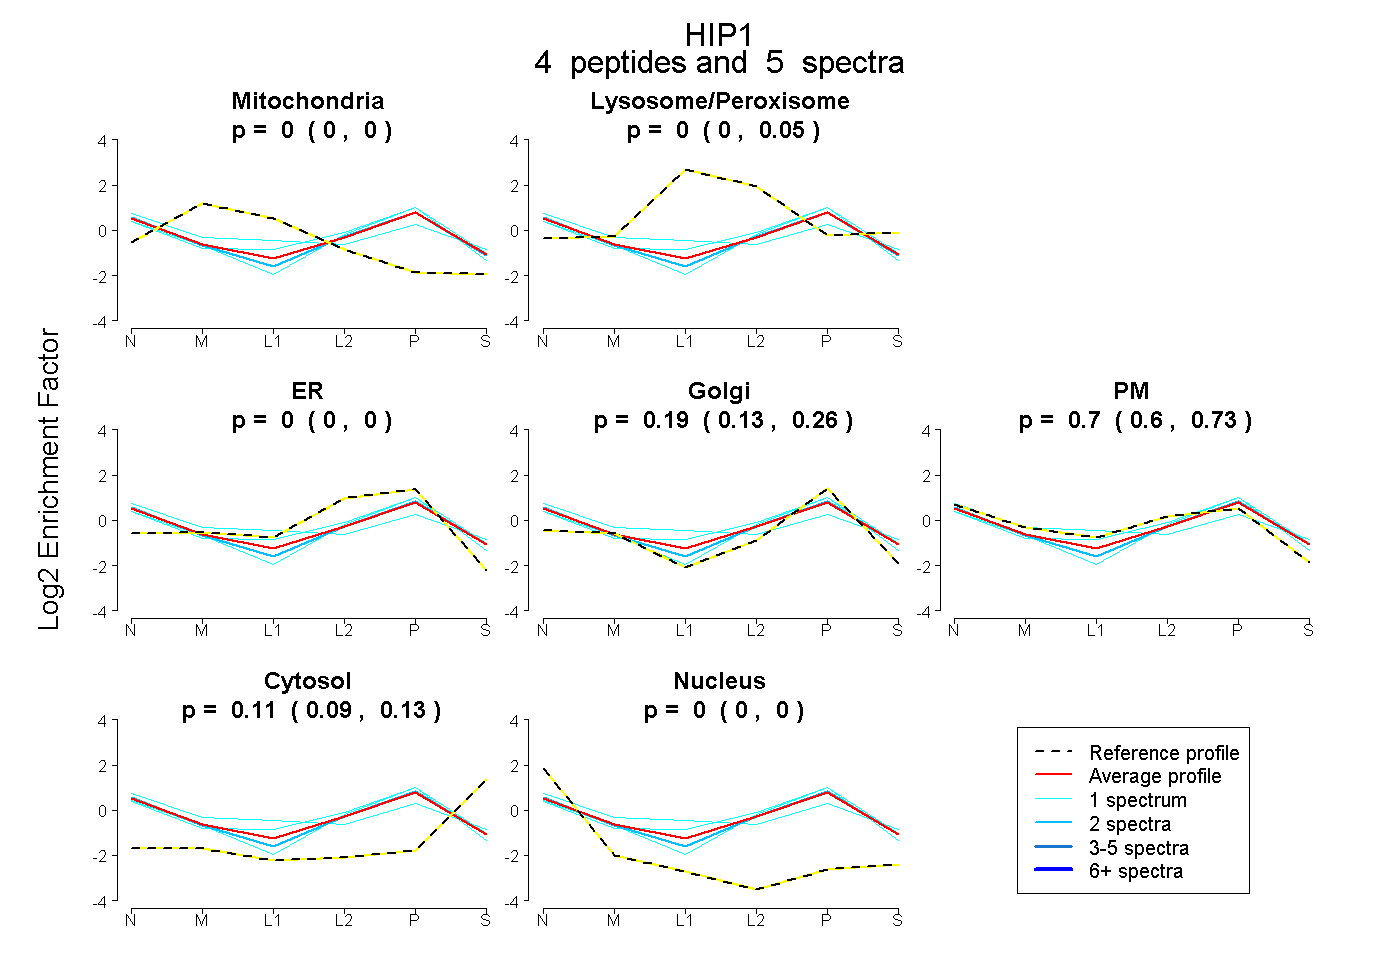
0.000 | 0.000
0.000 | 0.049
0.000 | 0.000
0.132 | 0.259
0.602 | 0.725
0.087 | 0.131
0.000 | 0.000
20peptides
spectra
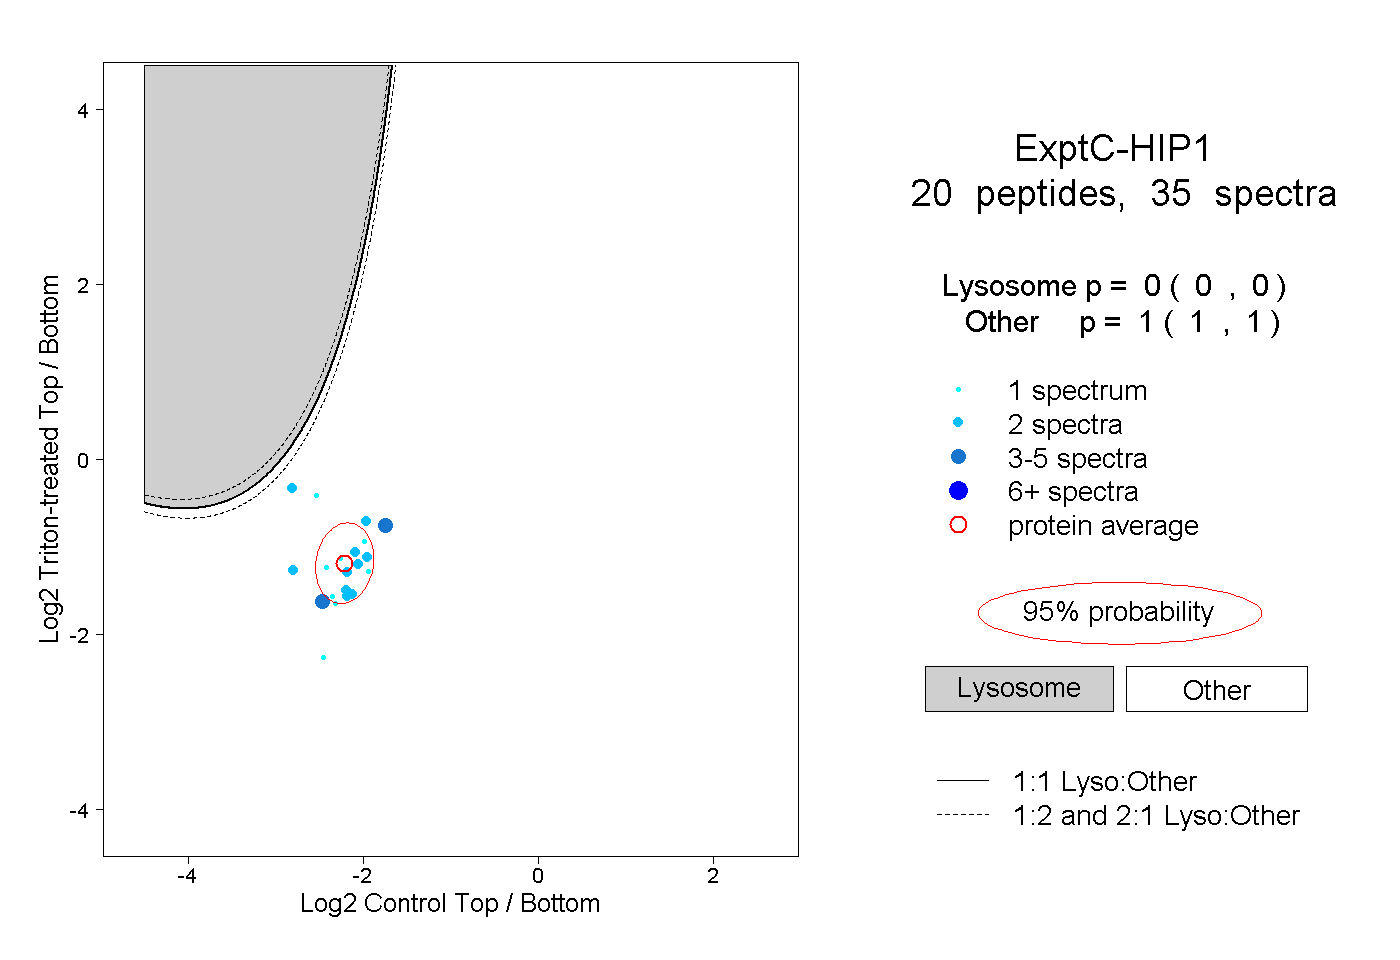
0.000 | 0.000
1.000 | 1.000
1peptide
spectra
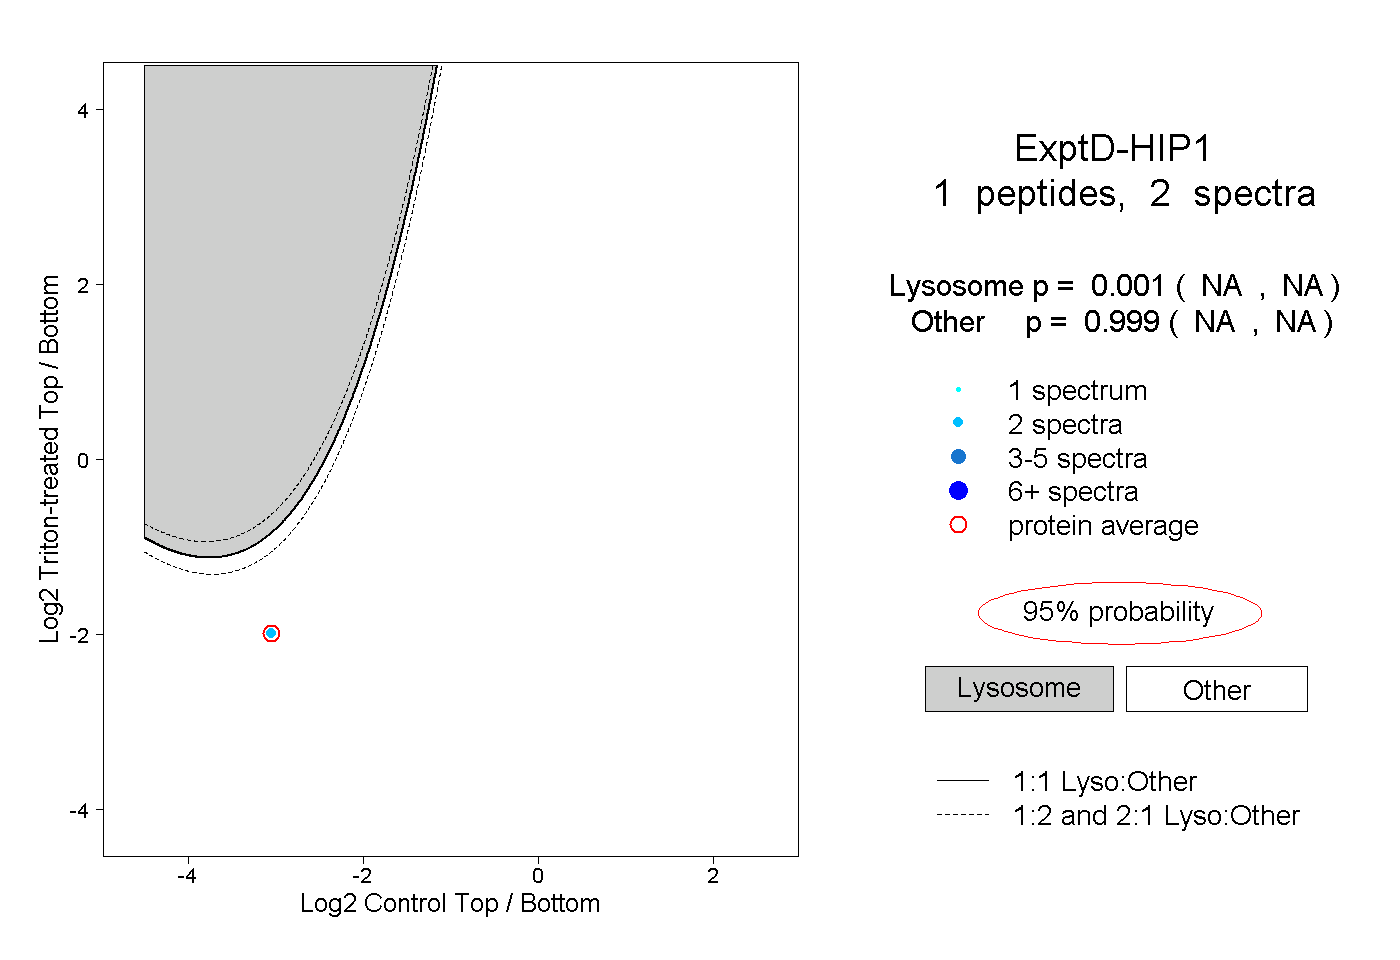
NA | NA
NA | NA