 20
20peptides
spectra
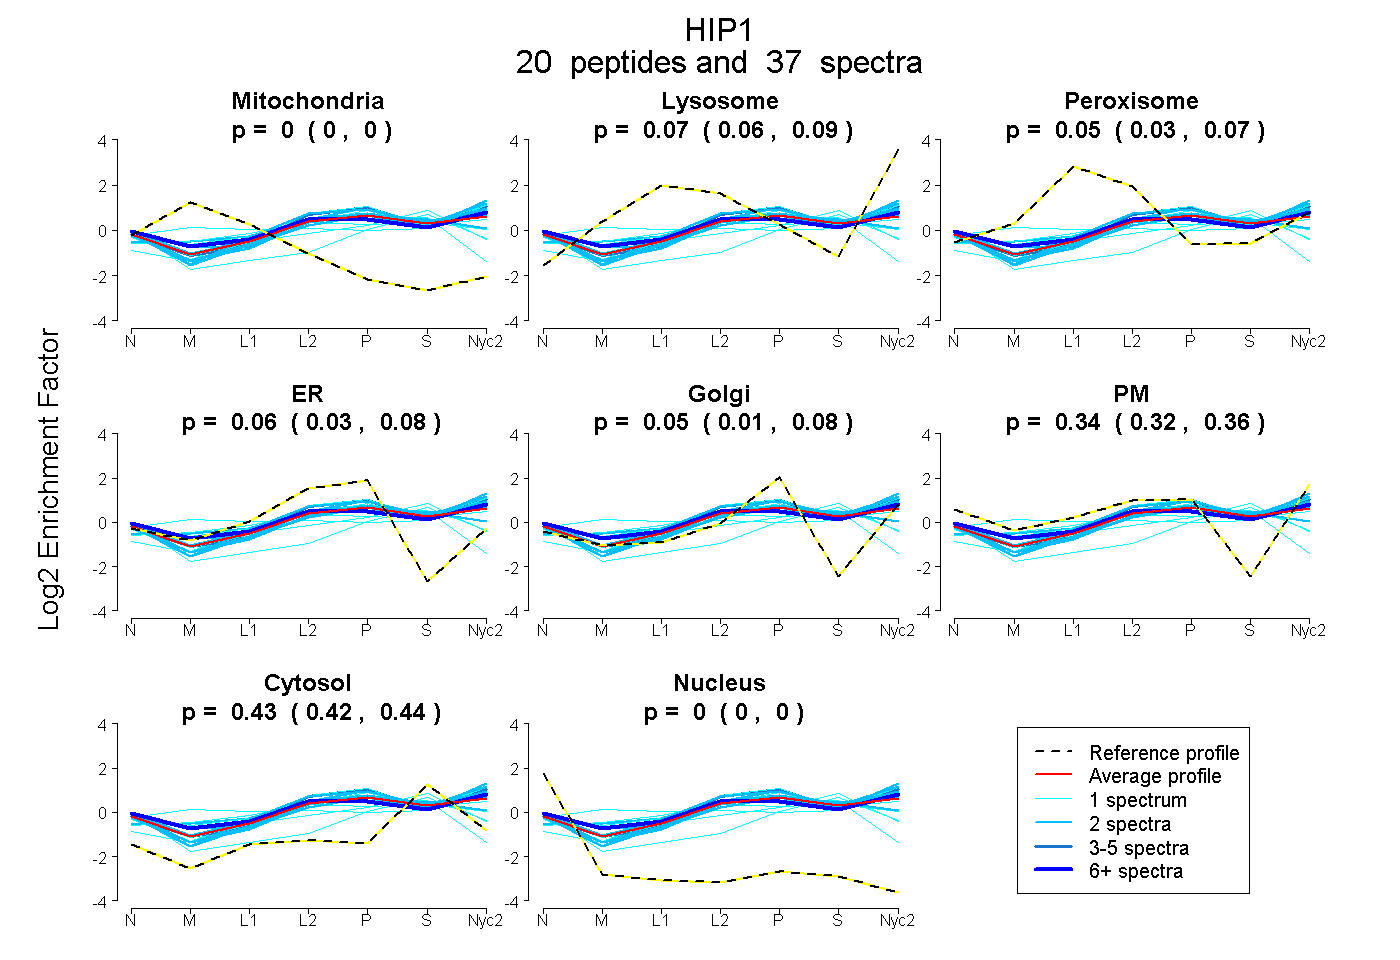
0.000 | 0.000
0.055 | 0.085
0.027 | 0.070
0.034 | 0.077
0.013 | 0.076
0.321 | 0.357
0.425 | 0.438
0.000 | 0.000
| Plot | Mito | Lyso | Perox | ER | Golgi | PM | Cytosol | Nucleus | |||||
| Expt A |
20 peptides |
37 spectra |
|
0.000 0.000 | 0.000 |
0.072 0.055 | 0.085 |
0.050 0.027 | 0.070 |
0.057 0.034 | 0.077 |
0.047 0.013 | 0.076 |
0.342 0.321 | 0.357 |
0.432 0.425 | 0.438 |
0.000 0.000 | 0.000 |
| 2 spectra, GAQTFWSVVNR | 0.000 | 0.060 | 0.060 | 0.085 | 0.000 | 0.387 | 0.407 | 0.000 | ||
| 2 spectra, QAQVDLER | 0.000 | 0.115 | 0.000 | 0.000 | 0.000 | 0.461 | 0.424 | 0.000 | ||
| 1 spectrum, APPESADSLTEACR | 0.057 | 0.248 | 0.086 | 0.000 | 0.000 | 0.270 | 0.339 | 0.000 | ||
| 2 spectra, SSNLQYFK | 0.000 | 0.176 | 0.000 | 0.063 | 0.038 | 0.329 | 0.393 | 0.000 | ||
| 1 spectrum, LPLSSNAMLCWK | 0.000 | 0.000 | 0.173 | 0.137 | 0.092 | 0.000 | 0.598 | 0.000 | ||
| 1 spectrum, LAGAQDSMCQQIK | 0.000 | 0.278 | 0.083 | 0.000 | 0.278 | 0.051 | 0.311 | 0.000 | ||
| 6 spectra, VSELEAELAEQQHLGR | 0.000 | 0.059 | 0.087 | 0.000 | 0.000 | 0.465 | 0.389 | 0.000 | ||
| 2 spectra, IEEILSK | 0.000 | 0.138 | 0.000 | 0.000 | 0.003 | 0.482 | 0.377 | 0.000 | ||
| 1 spectrum, GTASPK | 0.000 | 0.000 | 0.000 | 0.000 | 0.160 | 0.153 | 0.656 | 0.031 | ||
| 1 spectrum, FCHVFHK | 0.000 | 0.000 | 0.106 | 0.374 | 0.000 | 0.000 | 0.519 | 0.000 | ||
| 2 spectra, SVSVTTAGQCR | 0.000 | 0.000 | 0.065 | 0.172 | 0.050 | 0.215 | 0.498 | 0.000 | ||
| 1 spectrum, LLLAQR | 0.000 | 0.165 | 0.000 | 0.072 | 0.117 | 0.298 | 0.348 | 0.000 | ||
| 3 spectra, ILLAGAR | 0.000 | 0.143 | 0.000 | 0.056 | 0.119 | 0.322 | 0.359 | 0.000 | ||
| 2 spectra, VLVVASK | 0.000 | 0.077 | 0.000 | 0.032 | 0.074 | 0.343 | 0.474 | 0.000 | ||
| 2 spectra, EQGSLATAAAQR | 0.000 | 0.107 | 0.000 | 0.000 | 0.143 | 0.365 | 0.386 | 0.000 | ||
| 1 spectrum, HELATSR | 0.000 | 0.000 | 0.205 | 0.102 | 0.000 | 0.254 | 0.439 | 0.000 | ||
| 2 spectra, TIGEELLPR | 0.000 | 0.111 | 0.000 | 0.034 | 0.008 | 0.397 | 0.450 | 0.000 | ||
| 2 spectra, GSLNLTQLQQASR | 0.000 | 0.208 | 0.117 | 0.000 | 0.247 | 0.095 | 0.333 | 0.000 | ||
| 1 spectrum, EISGLTGQLDNVK | 0.000 | 0.043 | 0.126 | 0.124 | 0.161 | 0.171 | 0.376 | 0.000 | ||
| 2 spectra, ELADSFAR | 0.000 | 0.106 | 0.000 | 0.068 | 0.000 | 0.384 | 0.441 | 0.000 |
| Plot | Mito | Lyso or Perox | ER | Golgi | PM | Cytosol | Nucleus | ||||||
| Expt B |
4 peptides |
5 spectra |
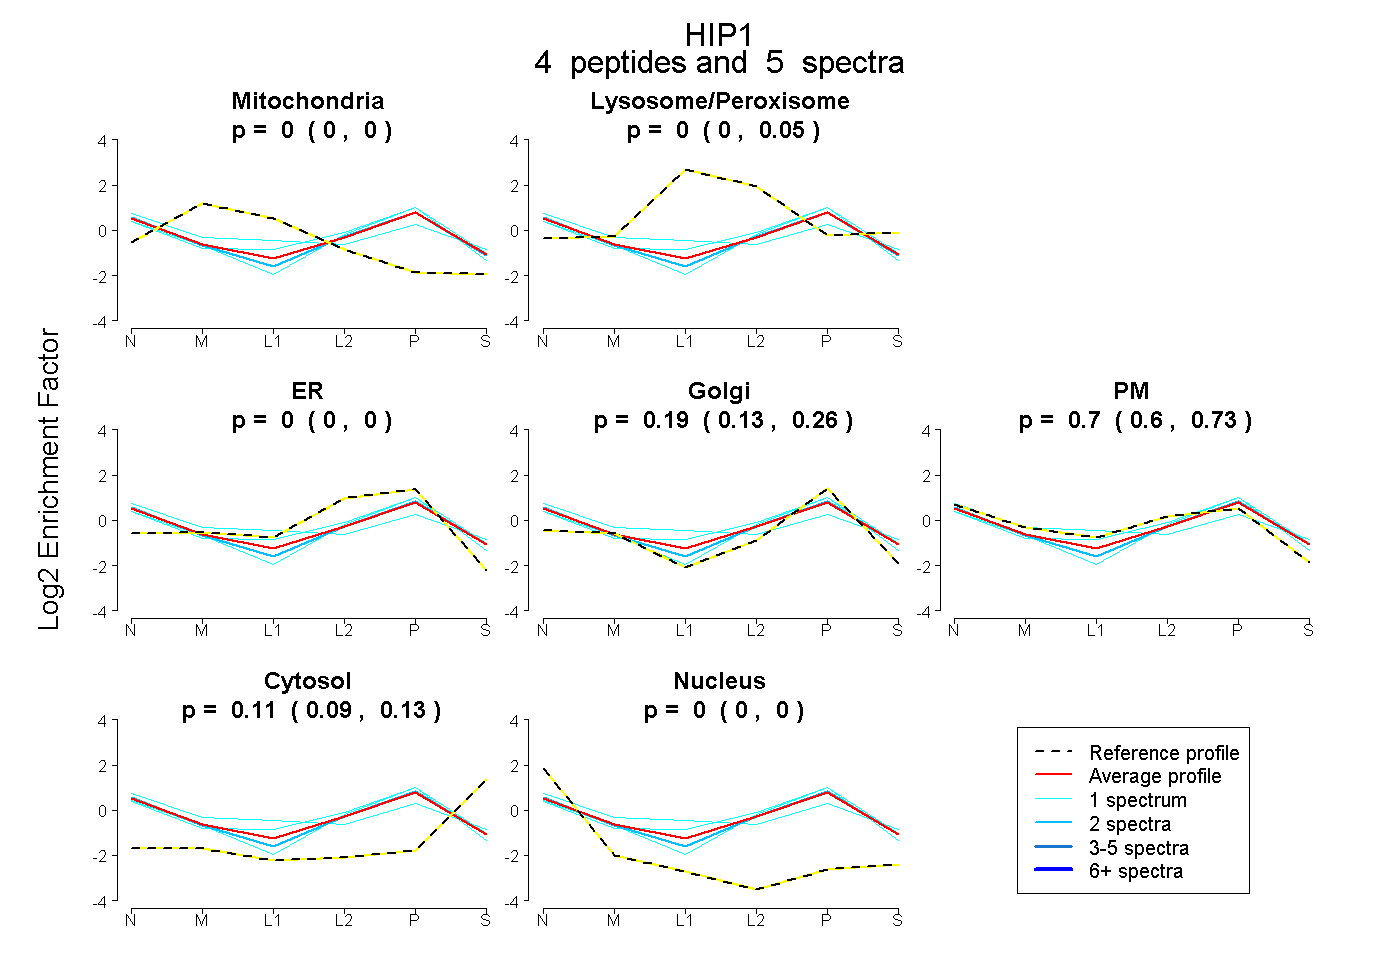 |
0.000 0.000 | 0.000 |
0.001 0.000 | 0.049 |
0.000 0.000 | 0.000 |
0.186 0.132 | 0.259 |
0.698 0.602 | 0.725 |
0.115 0.087 | 0.131 |
0.000 0.000 | 0.000 |
|||
| Plot | Lyso | Other | |||||||||||
| Expt C |
20 peptides |
35 spectra |
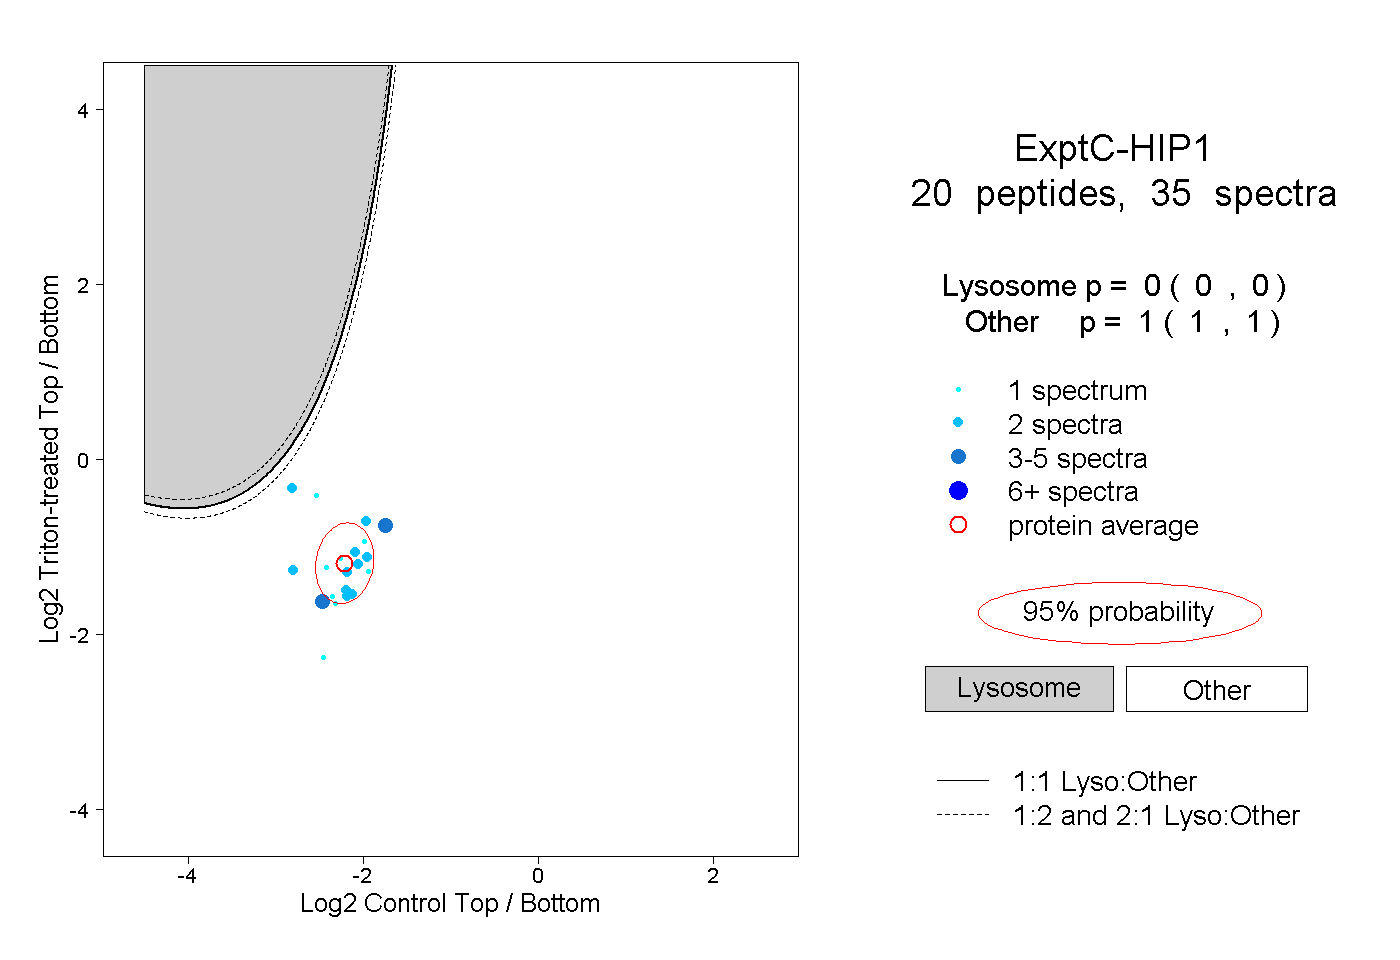 |
0.000 0.000 | 0.000 |
1.000 1.000 | 1.000 |
||||||||
| Plot | Lyso | Other | |||||||||||
| Expt D |
1 peptide |
2 spectra |
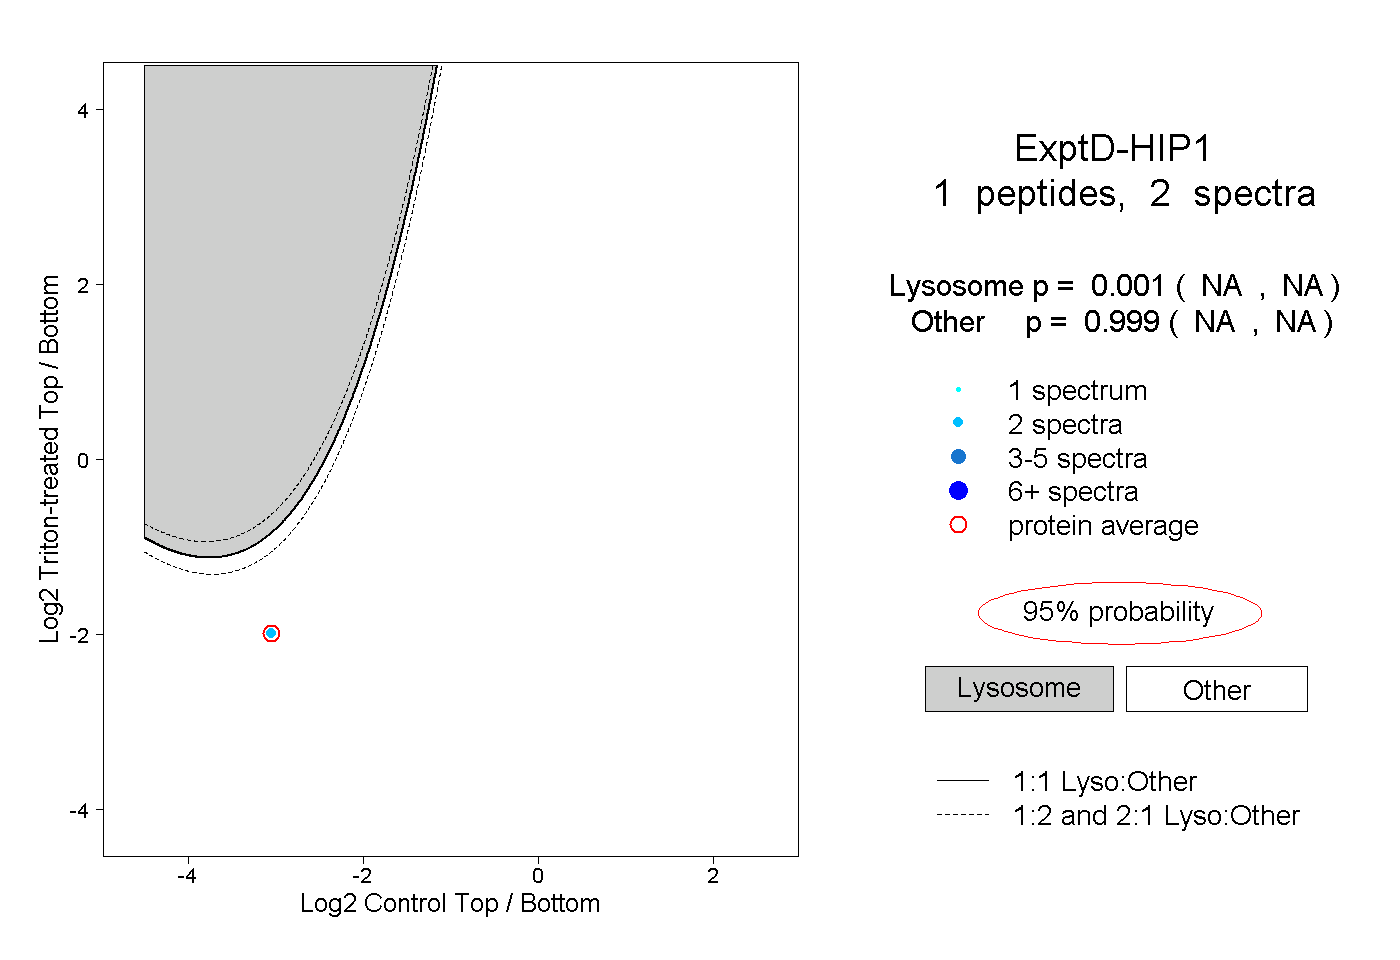 |
0.001 NA | NA |
0.999 NA | NA |