 7
7peptides
spectra
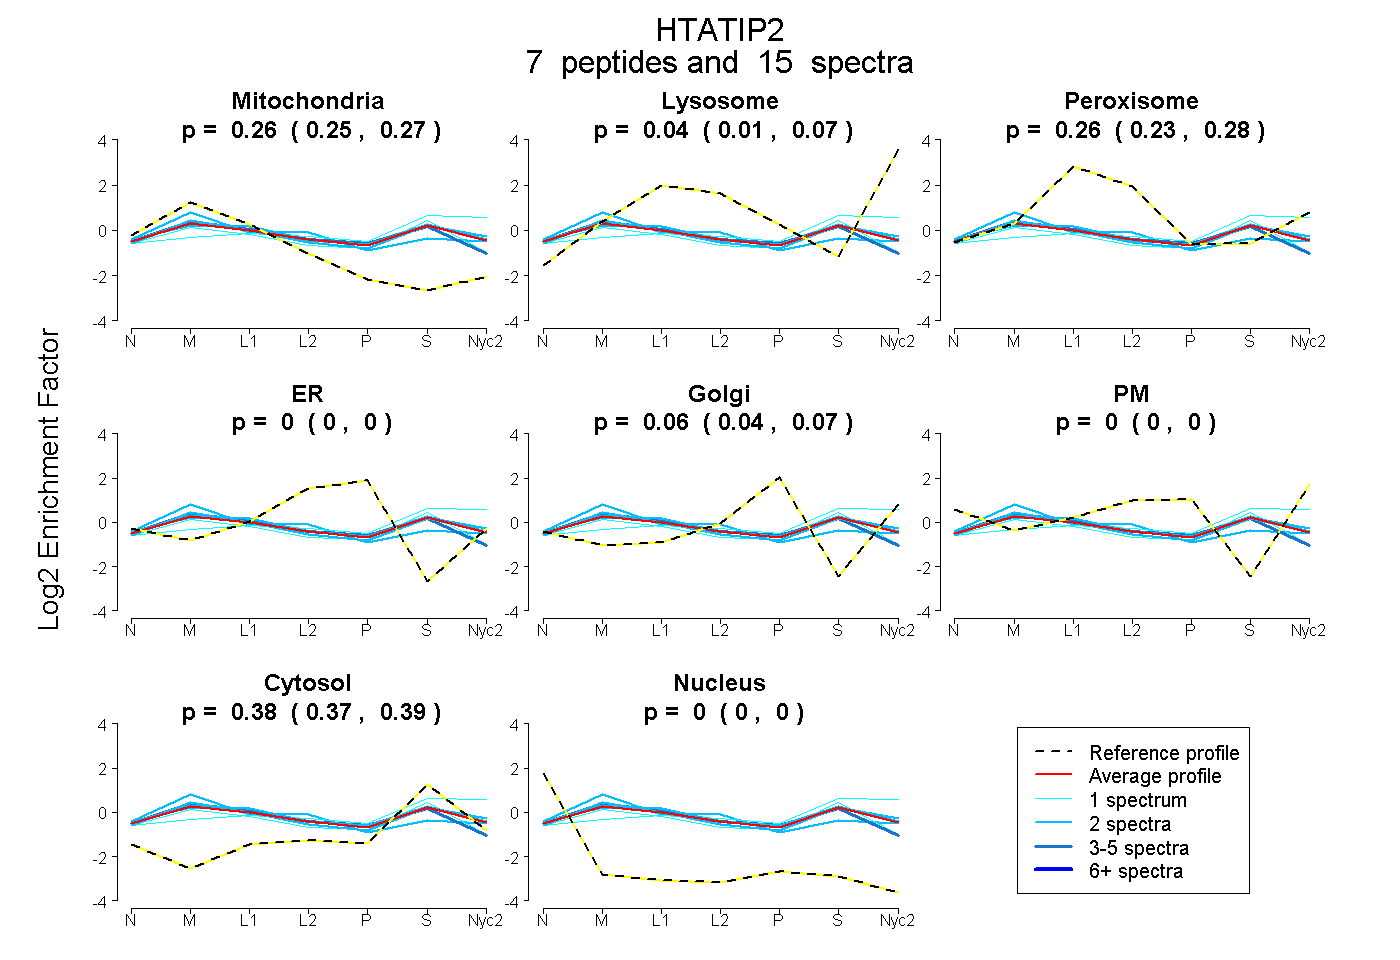
0.246 | 0.269
0.009 | 0.068
0.231 | 0.282
0.000 | 0.000
0.044 | 0.069
0.000 | 0.004
0.373 | 0.391
0.000 | 0.000
4peptides
spectra
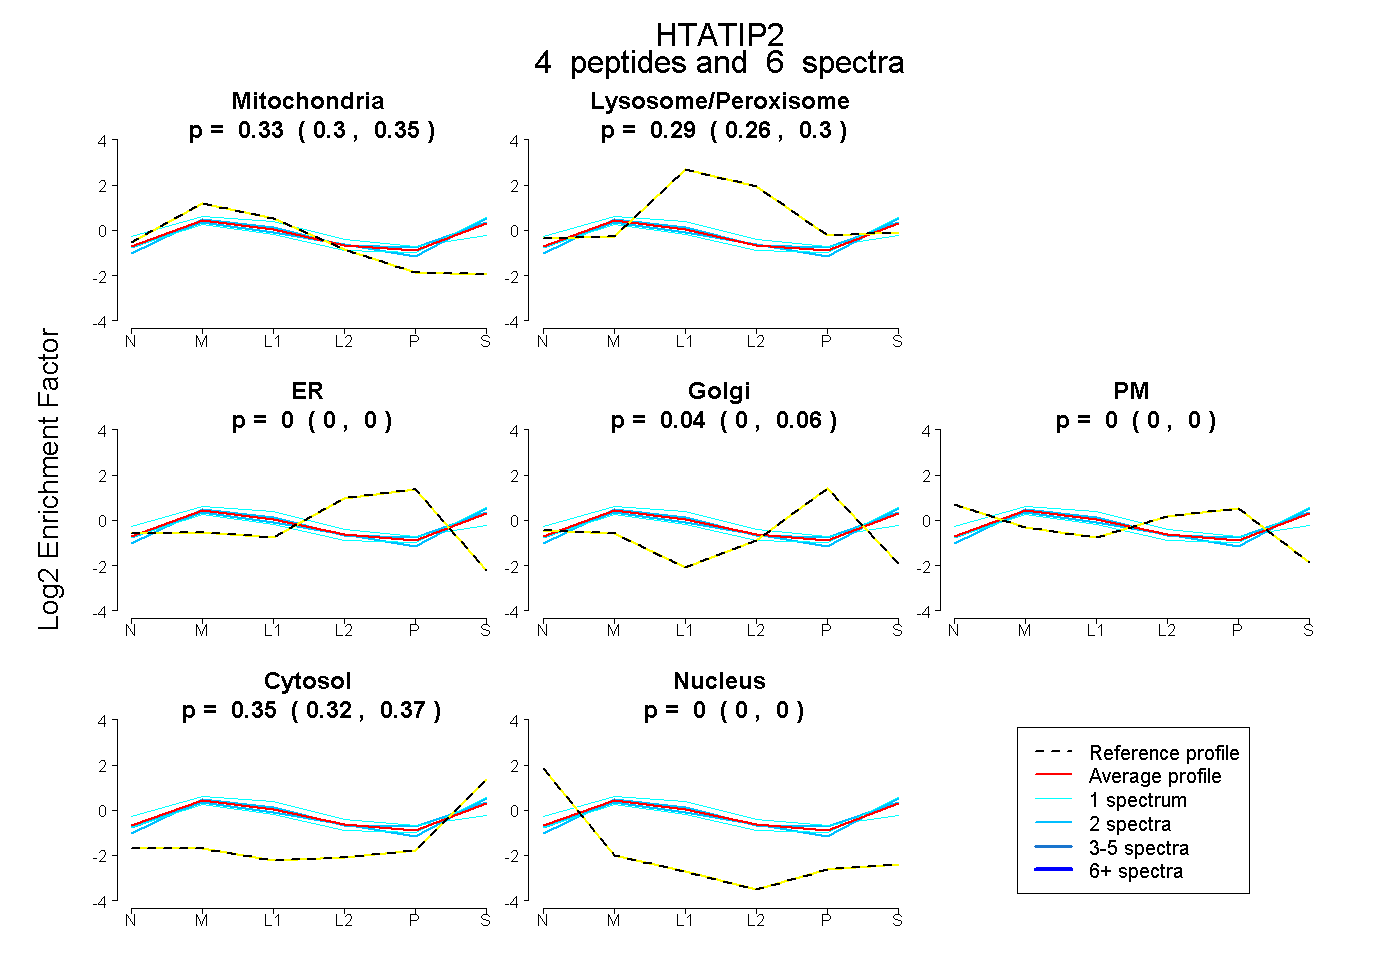
0.301 | 0.355
0.263 | 0.305
0.000 | 0.000
0.004 | 0.058
0.000 | 0.004
0.321 | 0.370
0.000 | 0.000
10peptides
spectra
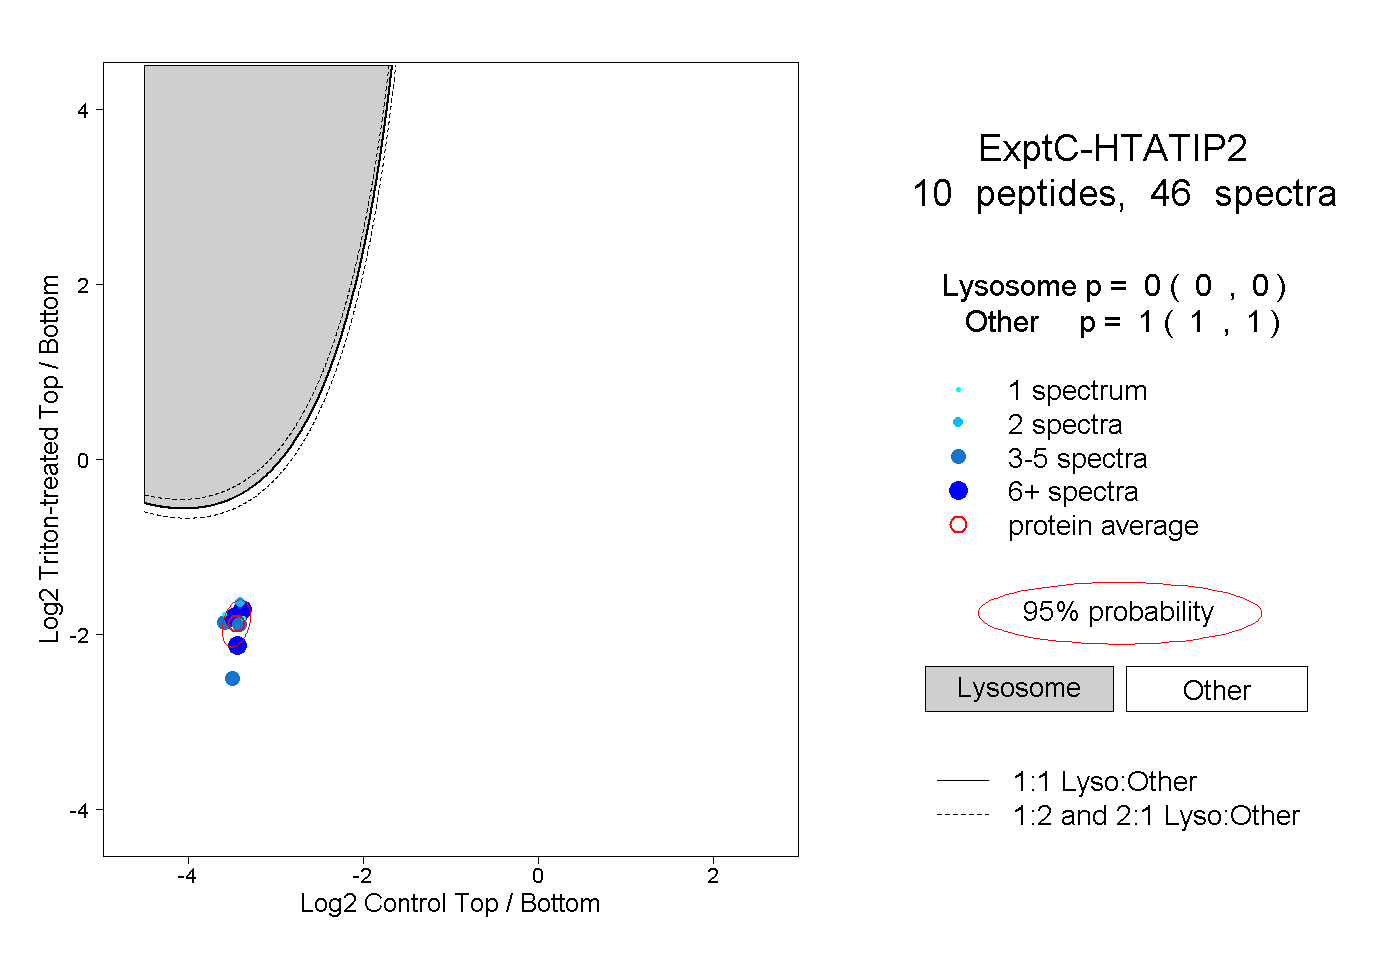
0.000 | 0.000
1.000 | 1.000
3peptides
spectra
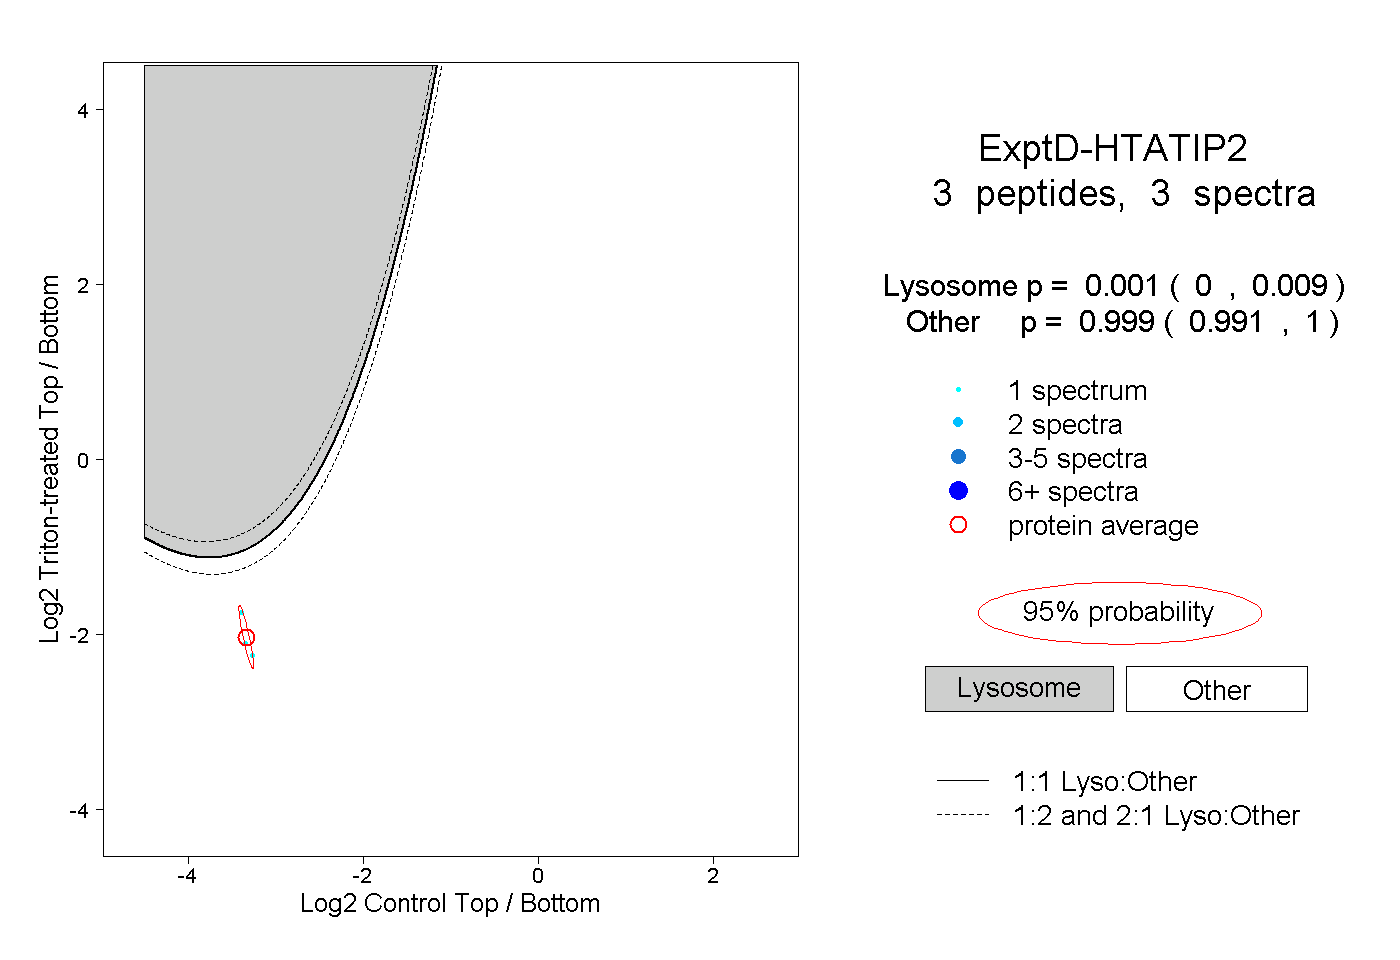
0.000 | 0.009
0.991 | 1.000