 7
7peptides
spectra
0.246 | 0.269
0.009 | 0.068
0.231 | 0.282
0.000 | 0.000
0.044 | 0.069
0.000 | 0.004
0.373 | 0.391
0.000 | 0.000
| Plot | Mito | Lyso | Perox | ER | Golgi | PM | Cytosol | Nucleus | |||||
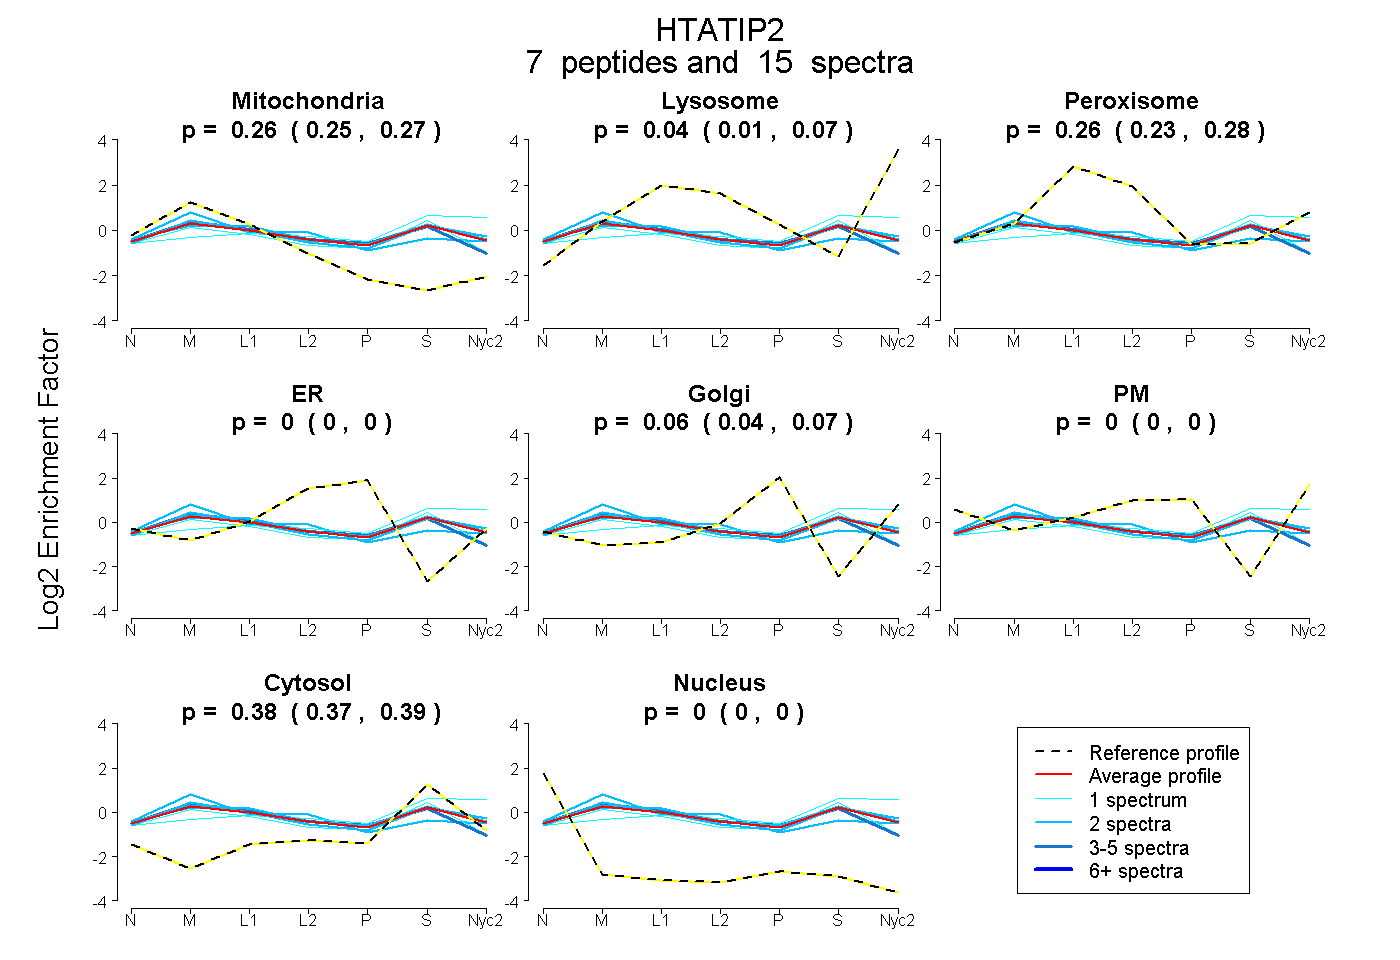
| Expt A |
7 peptides |
15 spectra |
|
0.258 0.246 | 0.269 |
0.041 0.009 | 0.068 |
0.259 0.231 | 0.282 |
0.000 0.000 | 0.000 |
0.059 0.044 | 0.069 |
0.000 0.000 | 0.004 |
0.383 0.373 | 0.391 |
0.000 0.000 | 0.000 |
| 5 spectra, LSVFRPGVLLCDR | 0.318 | 0.000 | 0.263 | 0.000 | 0.053 | 0.000 | 0.365 | 0.000 | ||
| 2 spectra, HFNLLSSR | 0.391 | 0.090 | 0.172 | 0.000 | 0.000 | 0.075 | 0.272 | 0.000 | ||
| 2 spectra, AILHLGK | 0.227 | 0.014 | 0.309 | 0.000 | 0.077 | 0.000 | 0.373 | 0.000 | ||
| 1 spectrum, QESRPGEWLAR | 0.063 | 0.209 | 0.124 | 0.000 | 0.000 | 0.097 | 0.507 | 0.000 | ||
| 2 spectra, SSSFLYLQVK | 0.249 | 0.076 | 0.257 | 0.000 | 0.053 | 0.000 | 0.365 | 0.000 | ||
| 1 spectrum, LDEYAPAFQGHDVGFCCLGTTR | 0.295 | 0.000 | 0.220 | 0.000 | 0.018 | 0.000 | 0.466 | 0.000 | ||
| 2 spectra, VTLIGR | 0.315 | 0.114 | 0.177 | 0.000 | 0.007 | 0.000 | 0.388 | 0.000 |
| Plot | Mito | Lyso or Perox | ER | Golgi | PM | Cytosol | Nucleus | ||||||
| Expt B |
4 peptides |
6 spectra |
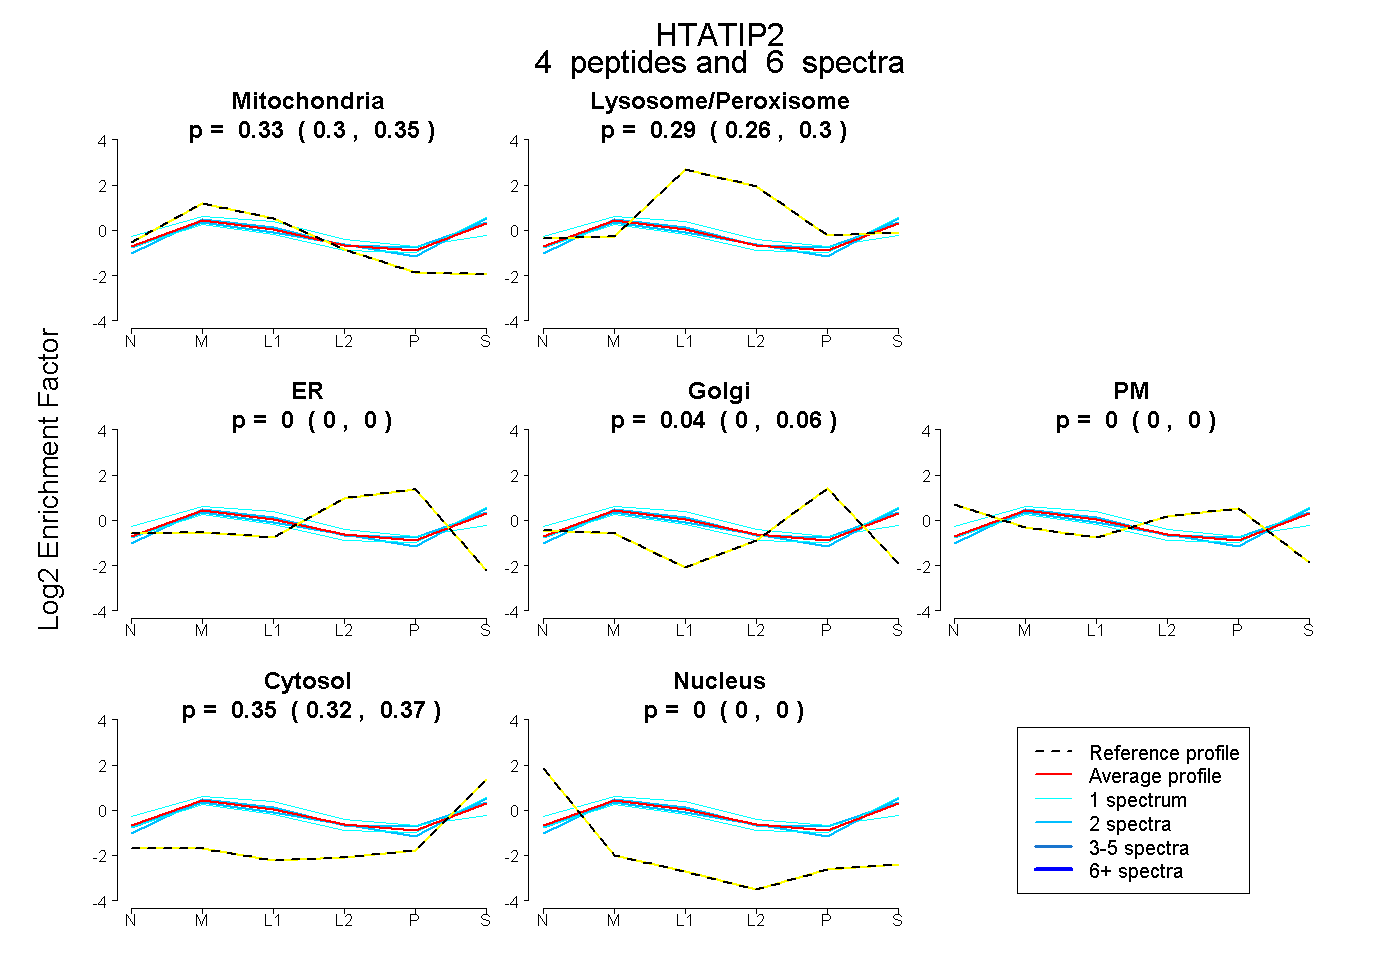 |
0.330 0.301 | 0.355 |
0.286 0.263 | 0.305 |
0.000 0.000 | 0.000 |
0.036 0.004 | 0.058 |
0.000 0.000 | 0.004 |
0.348 0.321 | 0.370 |
0.000 0.000 | 0.000 |
|||
| Plot | Lyso | Other | |||||||||||
| Expt C |
10 peptides |
46 spectra |
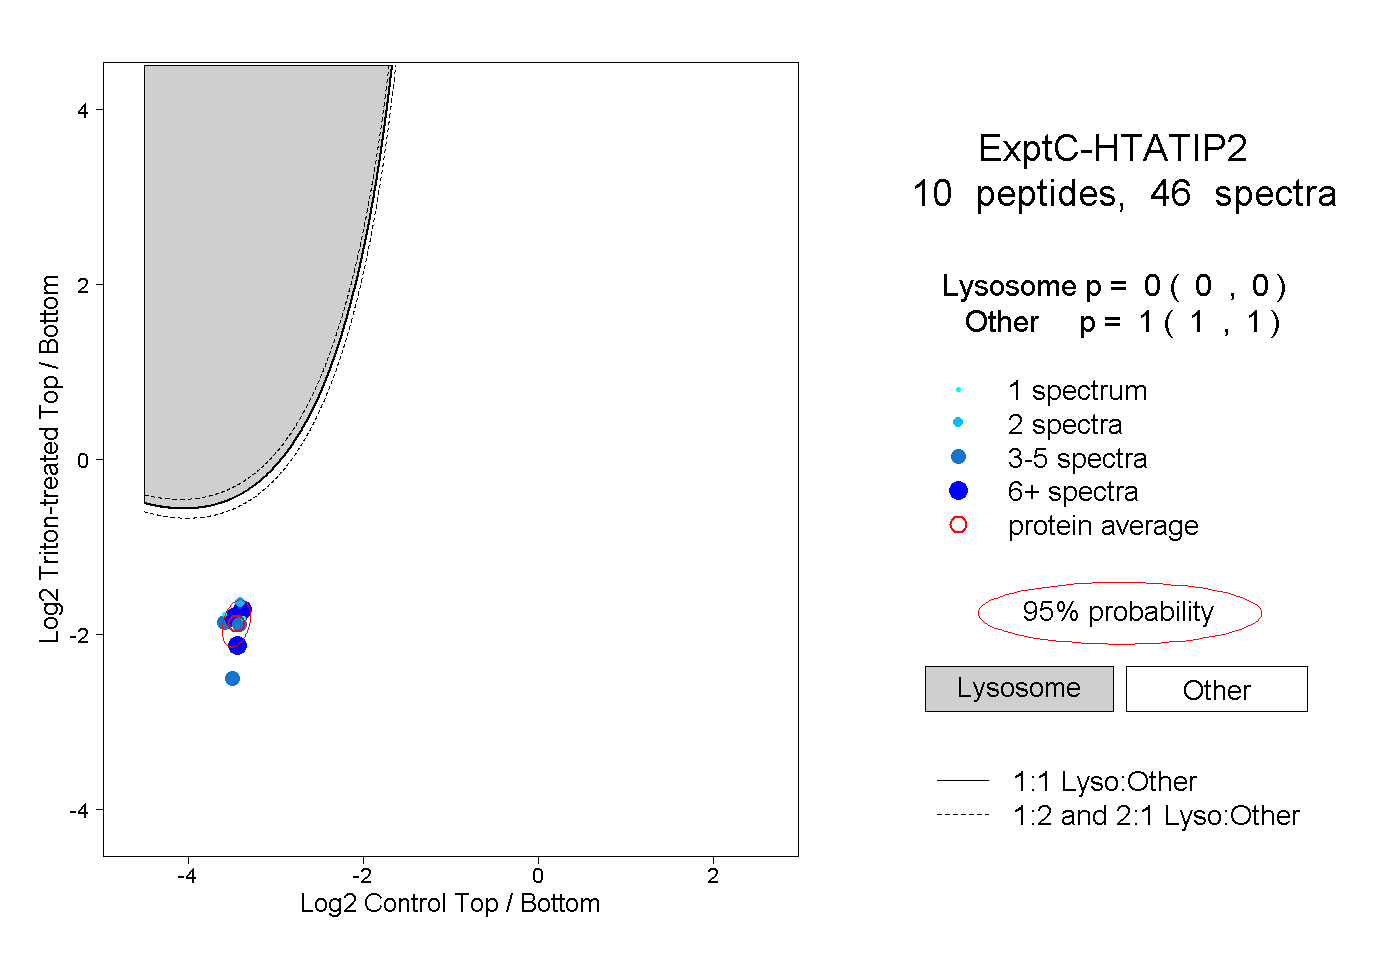 |
0.000 0.000 | 0.000 |
1.000 1.000 | 1.000 |
||||||||
| Plot | Lyso | Other | |||||||||||
| Expt D |
3 peptides |
3 spectra |
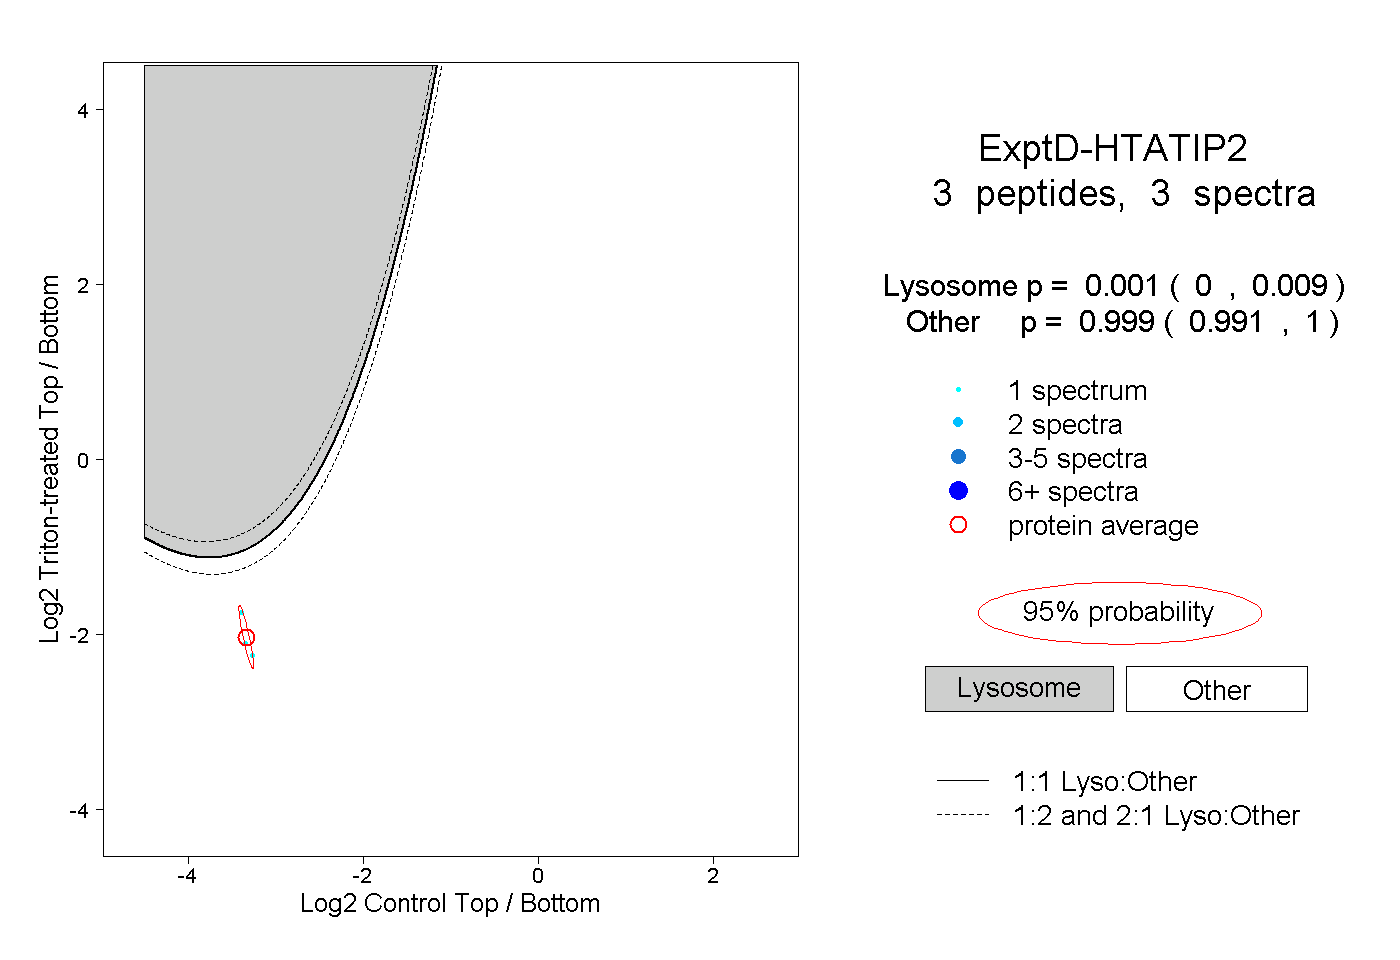 |
0.001 0.000 | 0.009 |
0.999 0.991 | 1.000 |