 11
11peptides
spectra
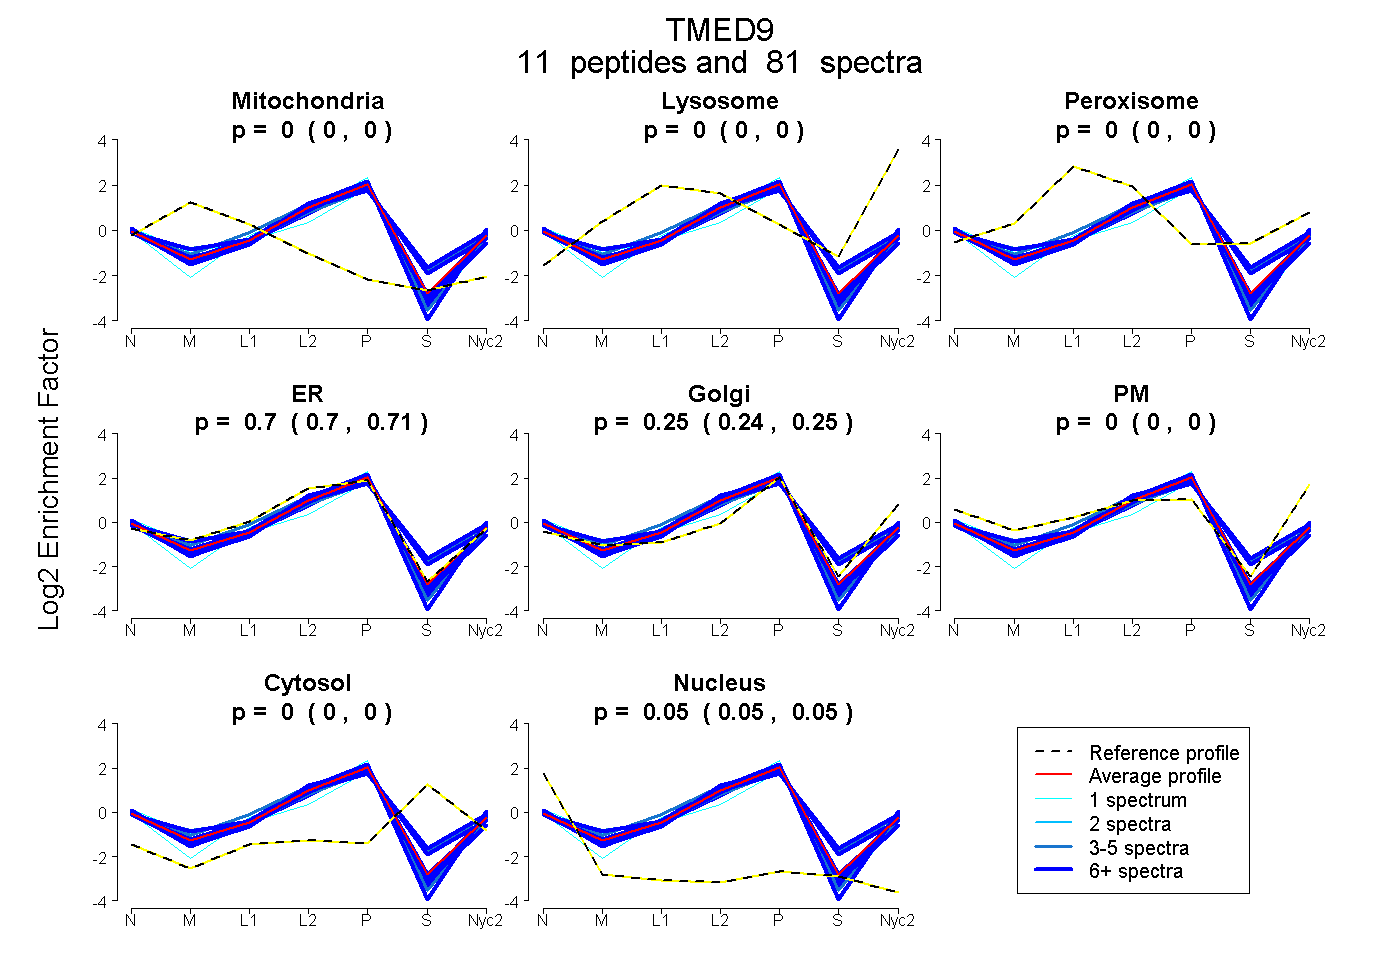
0.000 | 0.000
0.000 | 0.000
0.000 | 0.000
0.698 | 0.709
0.242 | 0.255
0.000 | 0.000
0.000 | 0.000
0.045 | 0.048
7peptides
spectra
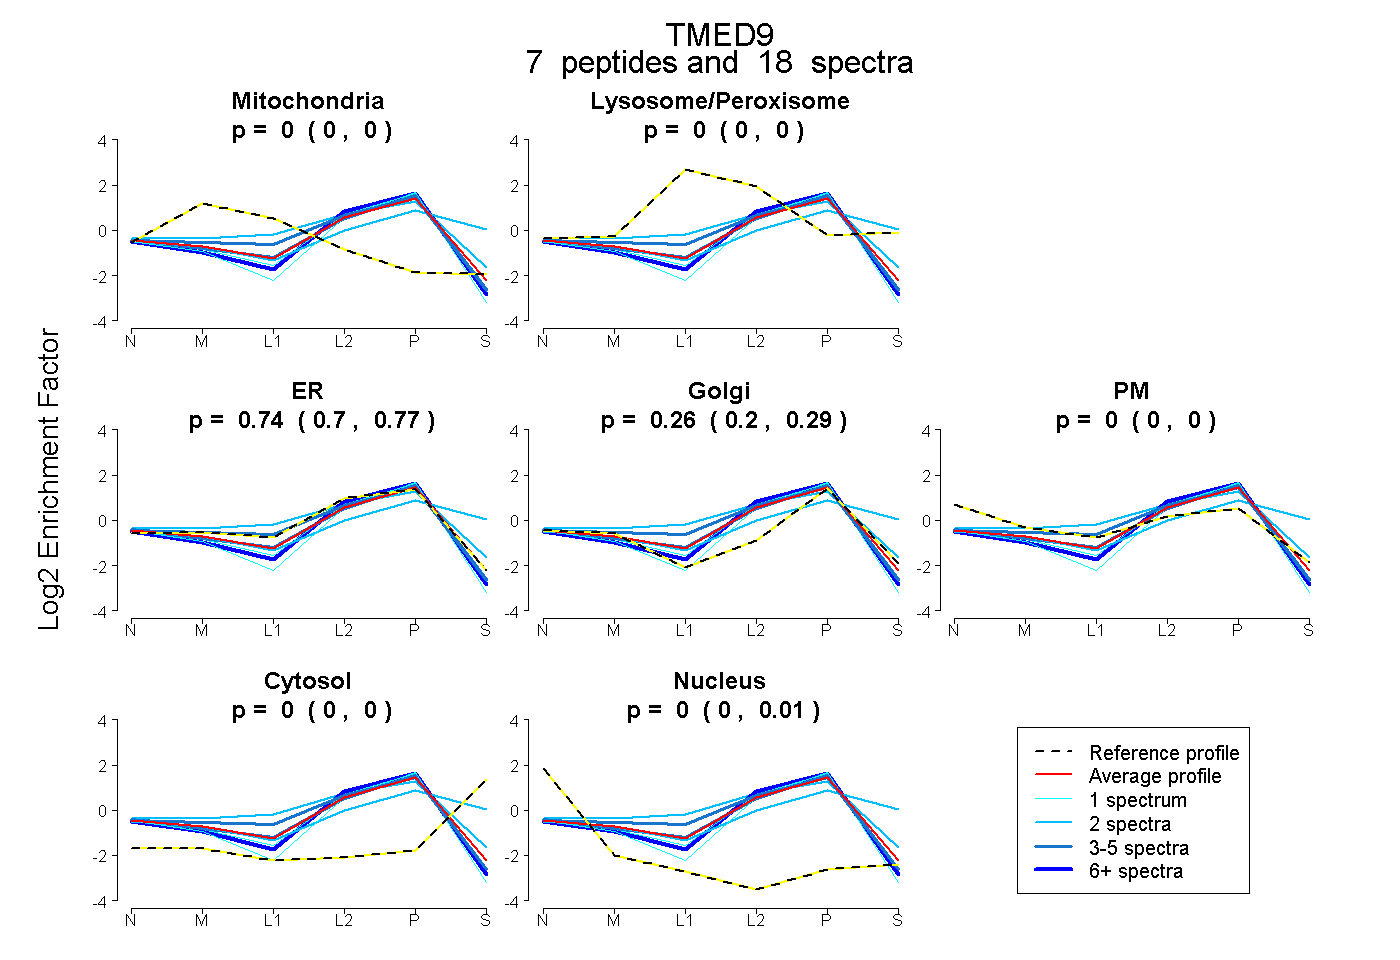
0.000 | 0.000
0.000 | 0.000
0.701 | 0.773
0.205 | 0.292
0.000 | 0.000
0.000 | 0.000
0.000 | 0.014
6peptides
spectra
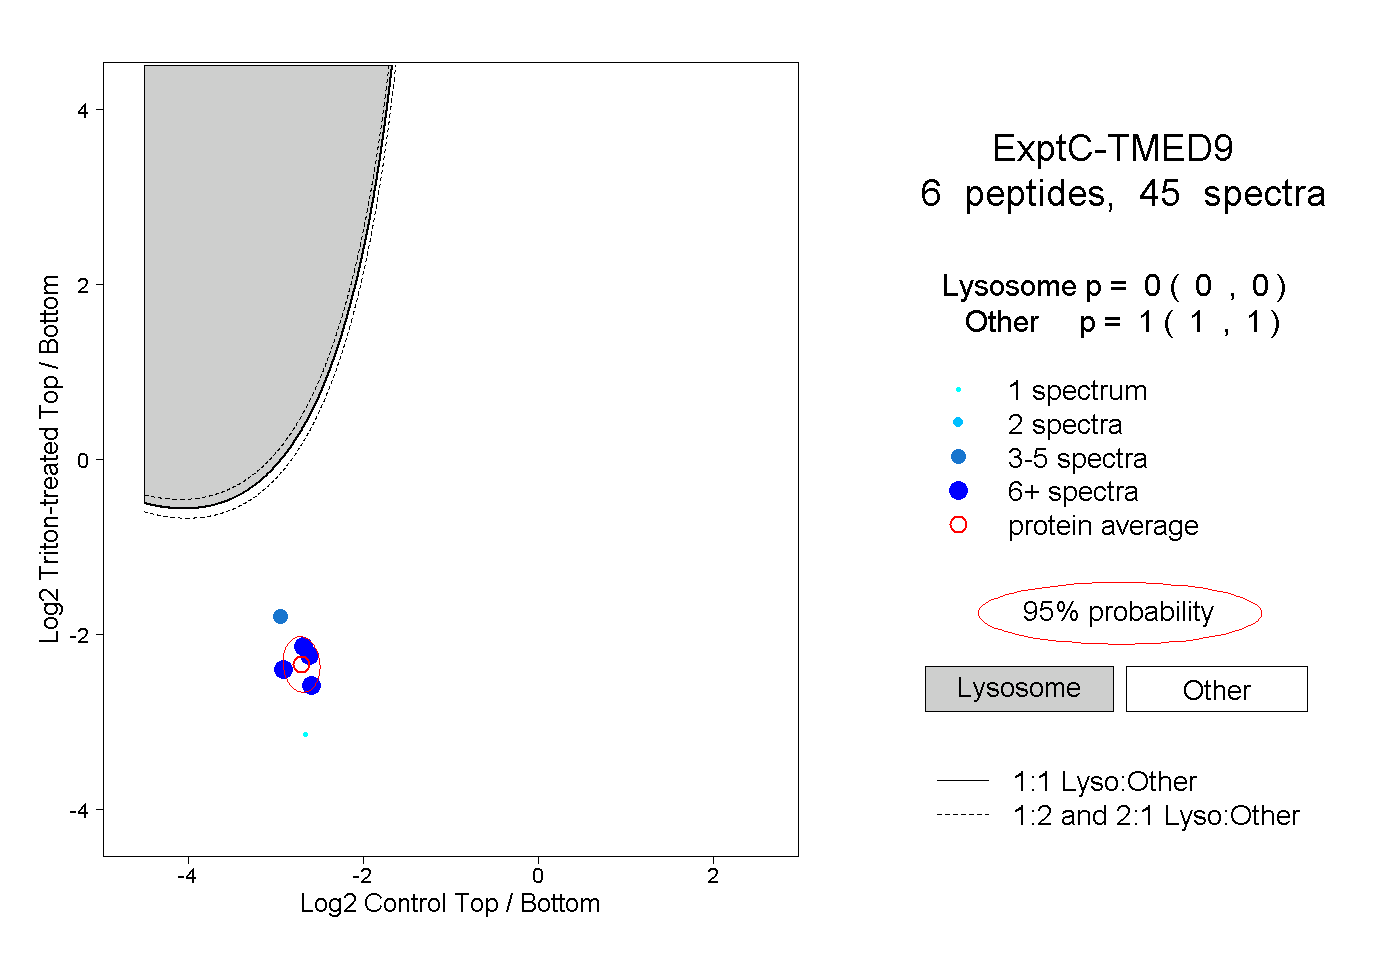
0.000 | 0.000
1.000 | 1.000
3peptides
spectra
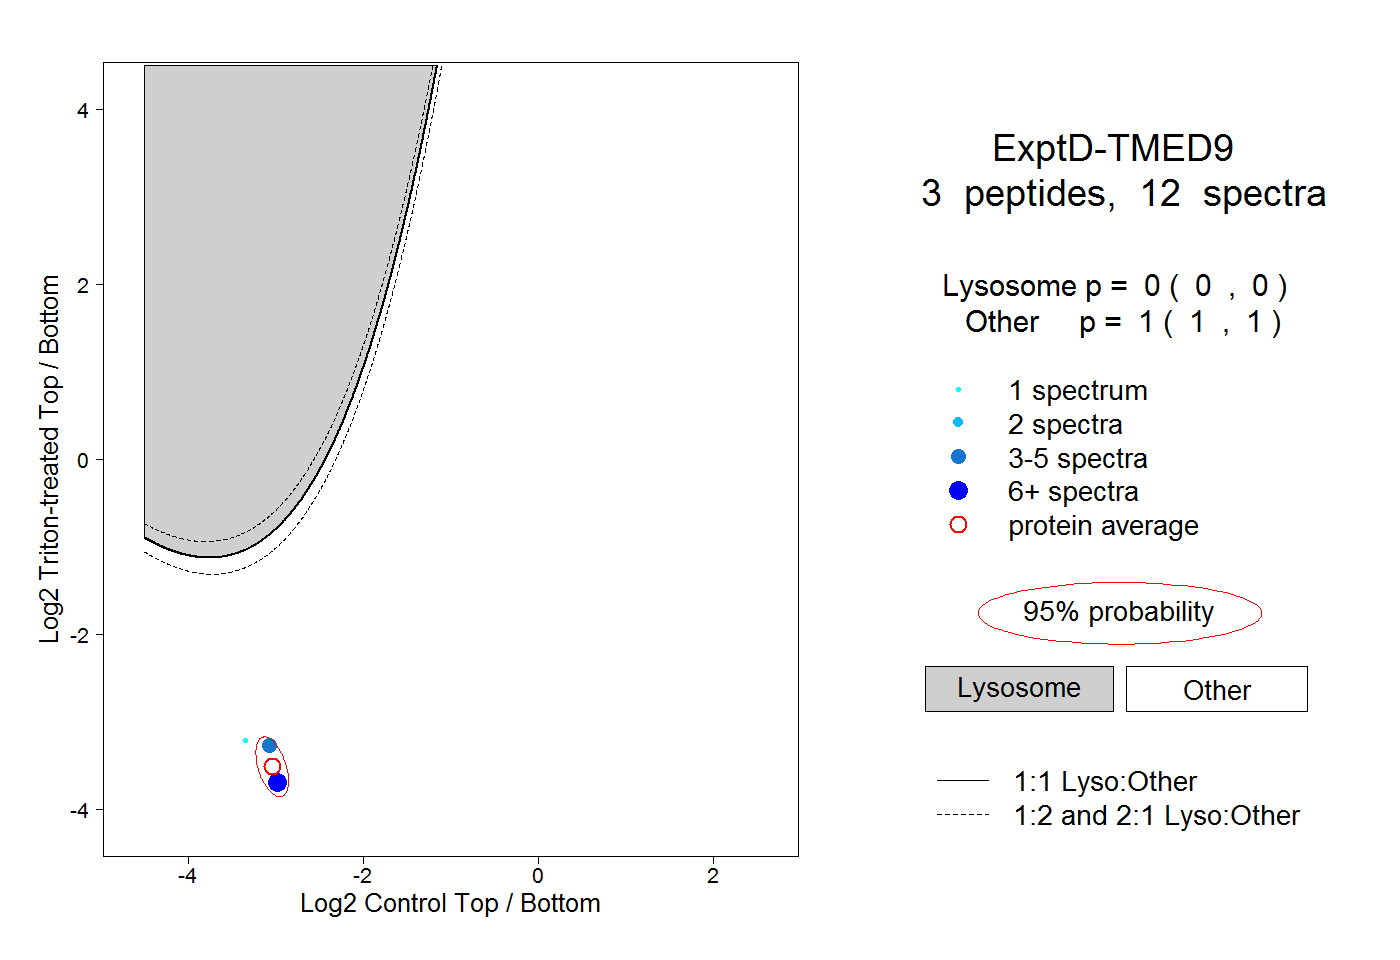
0.000 | 0.000
1.000 | 1.000