 11
11peptides
spectra
0.000 | 0.000
0.000 | 0.000
0.000 | 0.000
0.698 | 0.709
0.242 | 0.255
0.000 | 0.000
0.000 | 0.000
0.045 | 0.048
| Plot | Mito | Lyso | Perox | ER | Golgi | PM | Cytosol | Nucleus | |||||
| Expt A |
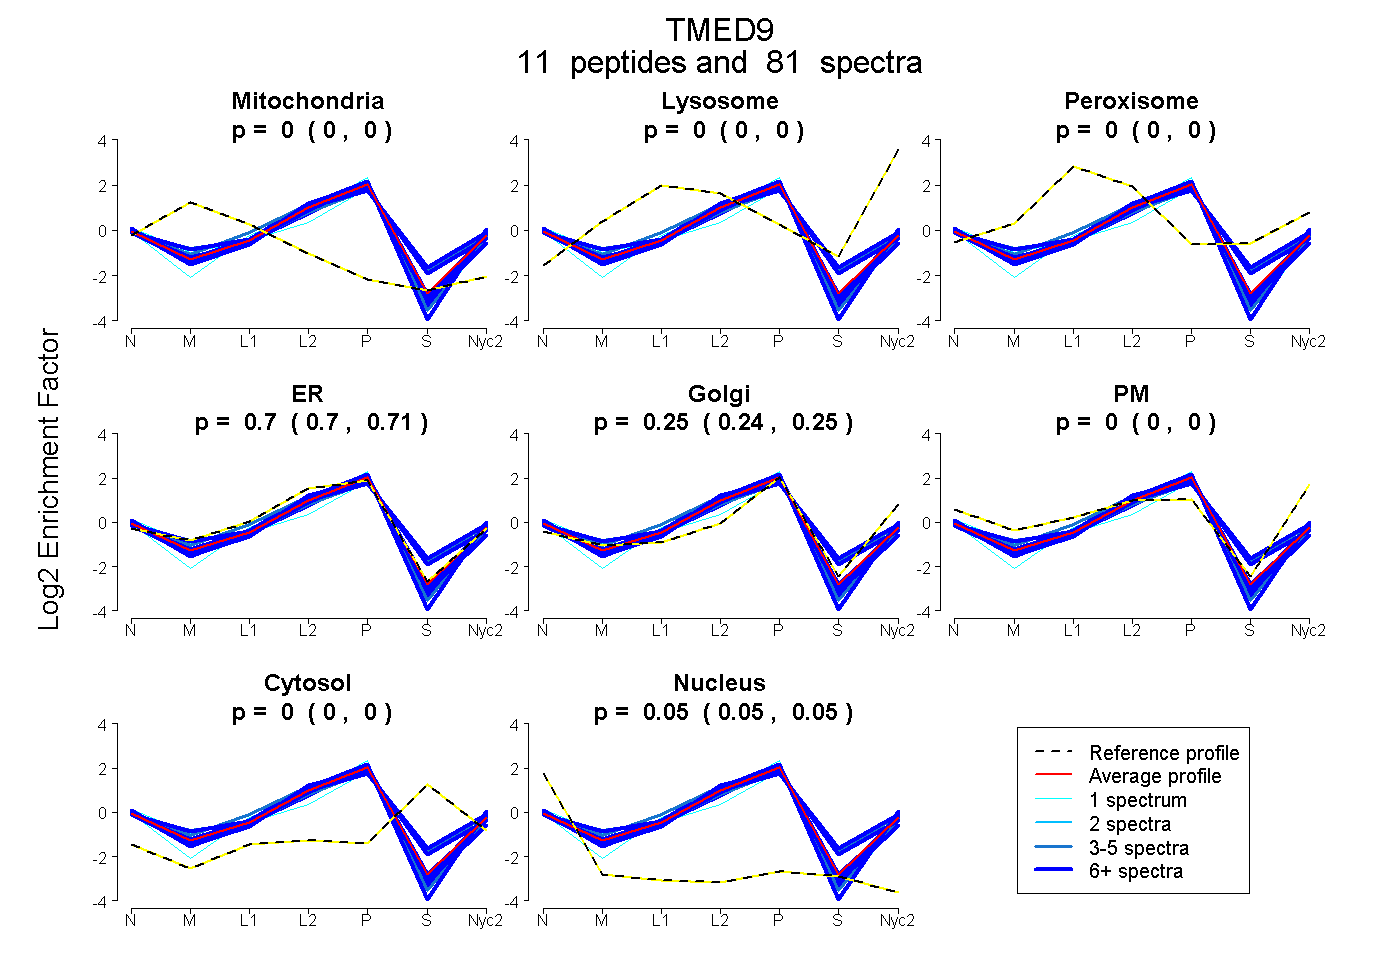
11 peptides |
81 spectra |
|
0.000 0.000 | 0.000 |
0.000 0.000 | 0.000 |
0.000 0.000 | 0.000 |
0.704 0.698 | 0.709 |
0.249 0.242 | 0.255 |
0.000 0.000 | 0.000 |
0.000 0.000 | 0.000 |
0.047 0.045 | 0.048 |
| 13 spectra, EQNYQR | 0.000 | 0.000 | 0.000 | 0.811 | 0.140 | 0.000 | 0.000 | 0.049 | ||
| 8 spectra, EQDYQR | 0.000 | 0.000 | 0.000 | 0.605 | 0.340 | 0.000 | 0.000 | 0.054 | ||
| 1 spectrum, EEYQPATPGLGMFVEVK | 0.000 | 0.000 | 0.000 | 0.410 | 0.413 | 0.065 | 0.081 | 0.031 | ||
| 8 spectra, TQLYDK | 0.000 | 0.000 | 0.000 | 0.656 | 0.149 | 0.062 | 0.133 | 0.000 | ||
| 13 spectra, FSLFAGGMLR | 0.000 | 0.000 | 0.000 | 0.664 | 0.295 | 0.000 | 0.000 | 0.041 | ||
| 9 spectra, QTSESTNQR | 0.000 | 0.000 | 0.000 | 0.699 | 0.262 | 0.000 | 0.000 | 0.038 | ||
| 5 spectra, LSELQLR | 0.000 | 0.000 | 0.000 | 0.870 | 0.104 | 0.000 | 0.000 | 0.026 | ||
| 3 spectra, QLVEQVEQIQK | 0.000 | 0.000 | 0.000 | 0.623 | 0.264 | 0.001 | 0.112 | 0.000 | ||
| 6 spectra, SFFEAK | 0.000 | 0.000 | 0.000 | 0.756 | 0.167 | 0.000 | 0.000 | 0.077 | ||
| 14 spectra, QYGSEGR | 0.000 | 0.000 | 0.000 | 0.775 | 0.105 | 0.000 | 0.115 | 0.005 | ||
| 1 spectrum, CFIEEIPDETMVIGNYR | 0.000 | 0.000 | 0.000 | 0.704 | 0.247 | 0.000 | 0.000 | 0.049 |
| Plot | Mito | Lyso or Perox | ER | Golgi | PM | Cytosol | Nucleus | ||||||
| Expt B |
7 peptides |
18 spectra |
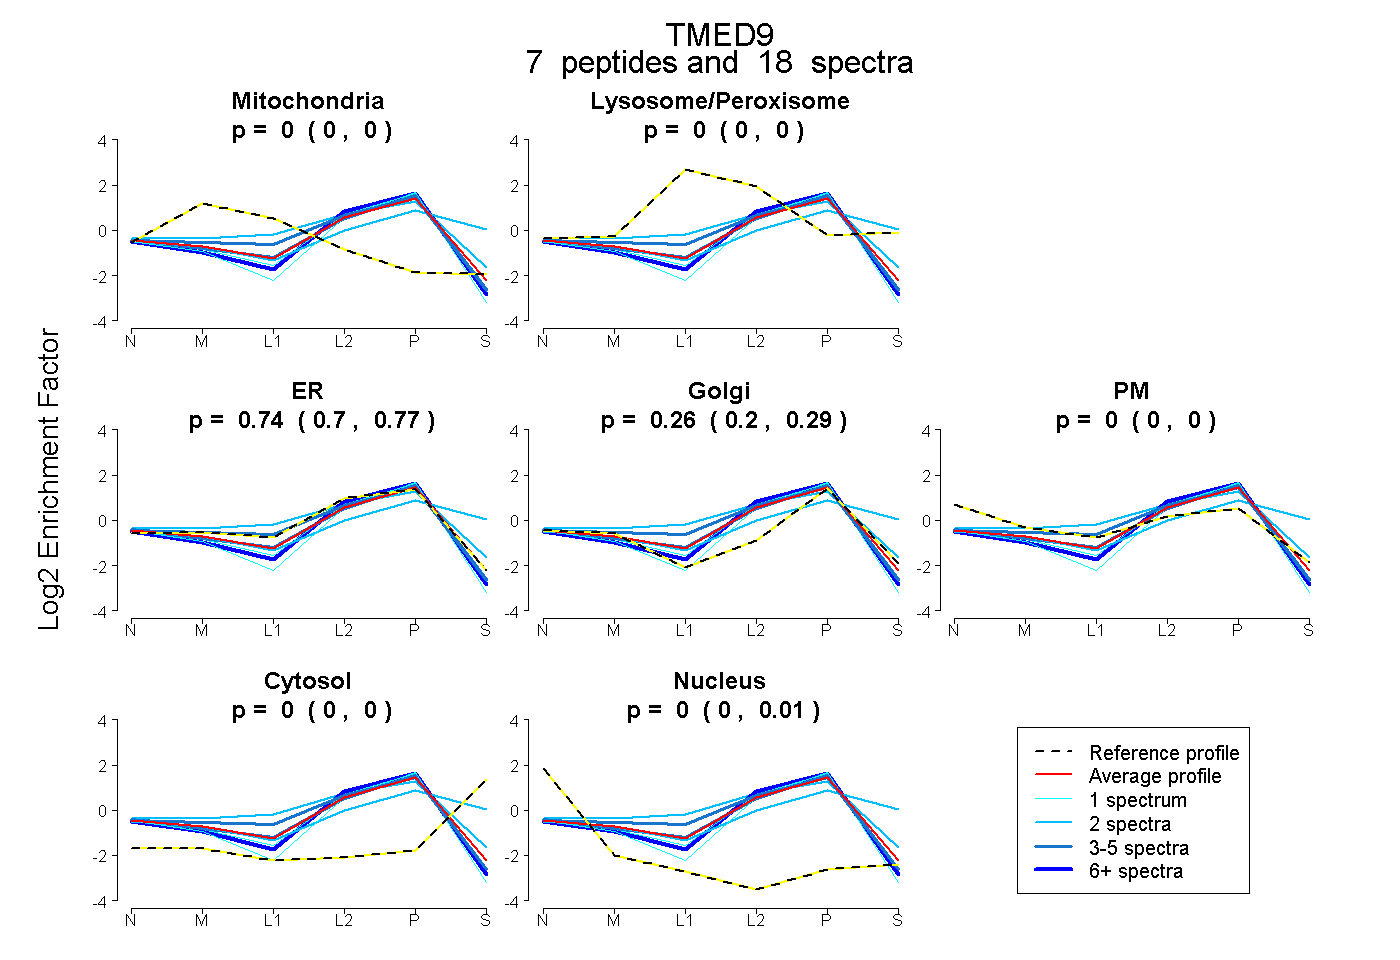 |
0.000 0.000 | 0.000 |
0.000 0.000 | 0.000 |
0.739 0.701 | 0.773 |
0.256 0.205 | 0.292 |
0.000 0.000 | 0.000 |
0.000 0.000 | 0.000 |
0.005 0.000 | 0.014 |
|||
| Plot | Lyso | Other | |||||||||||
| Expt C |
6 peptides |
45 spectra |
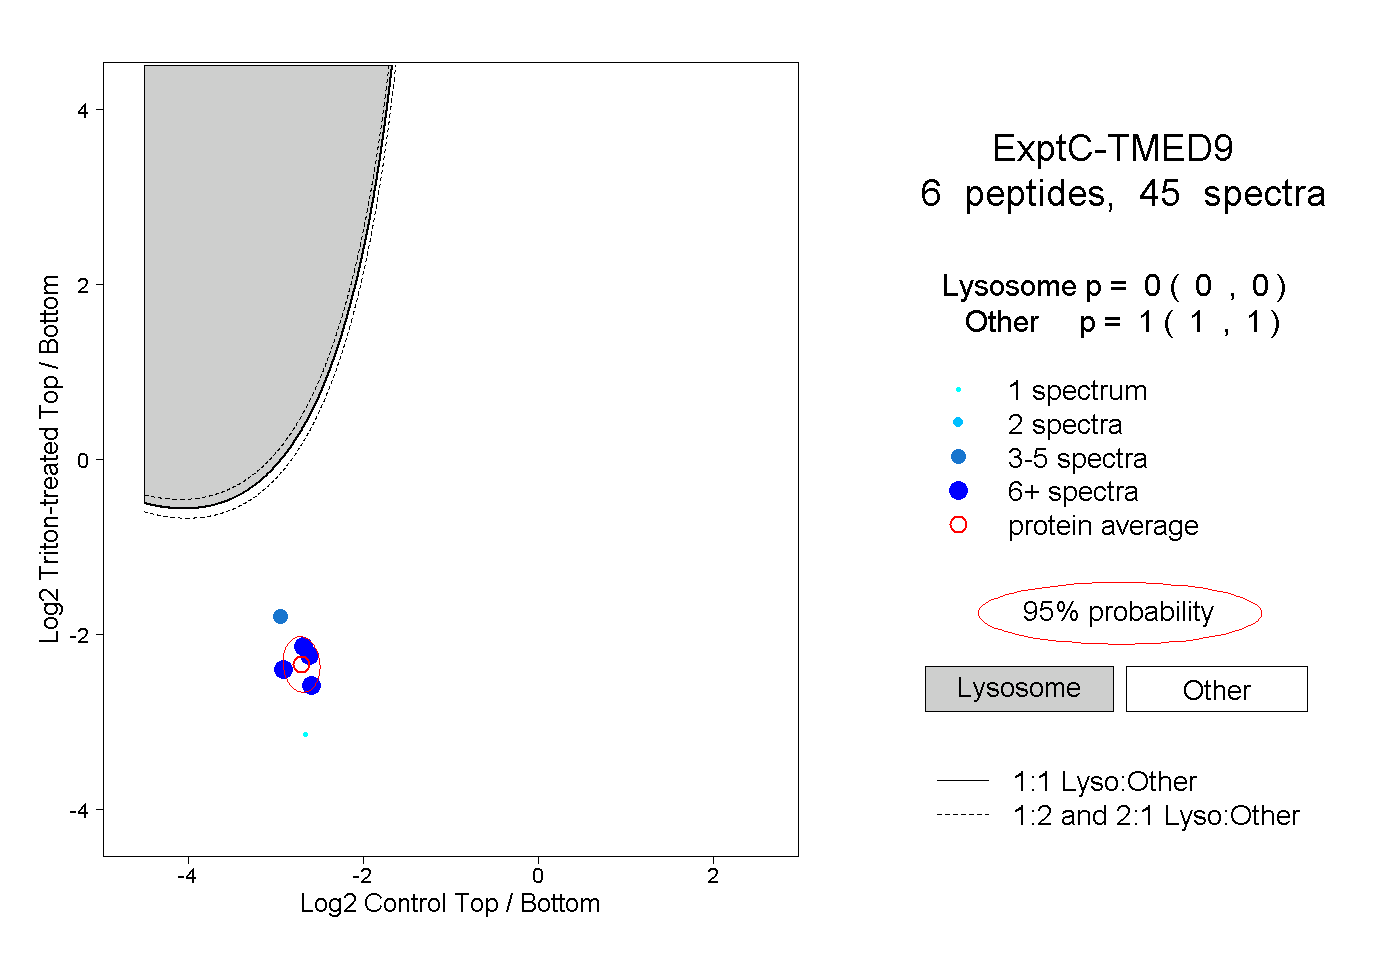 |
0.000 0.000 | 0.000 |
1.000 1.000 | 1.000 |
||||||||
| Plot | Lyso | Other | |||||||||||
| Expt D |
3 peptides |
12 spectra |
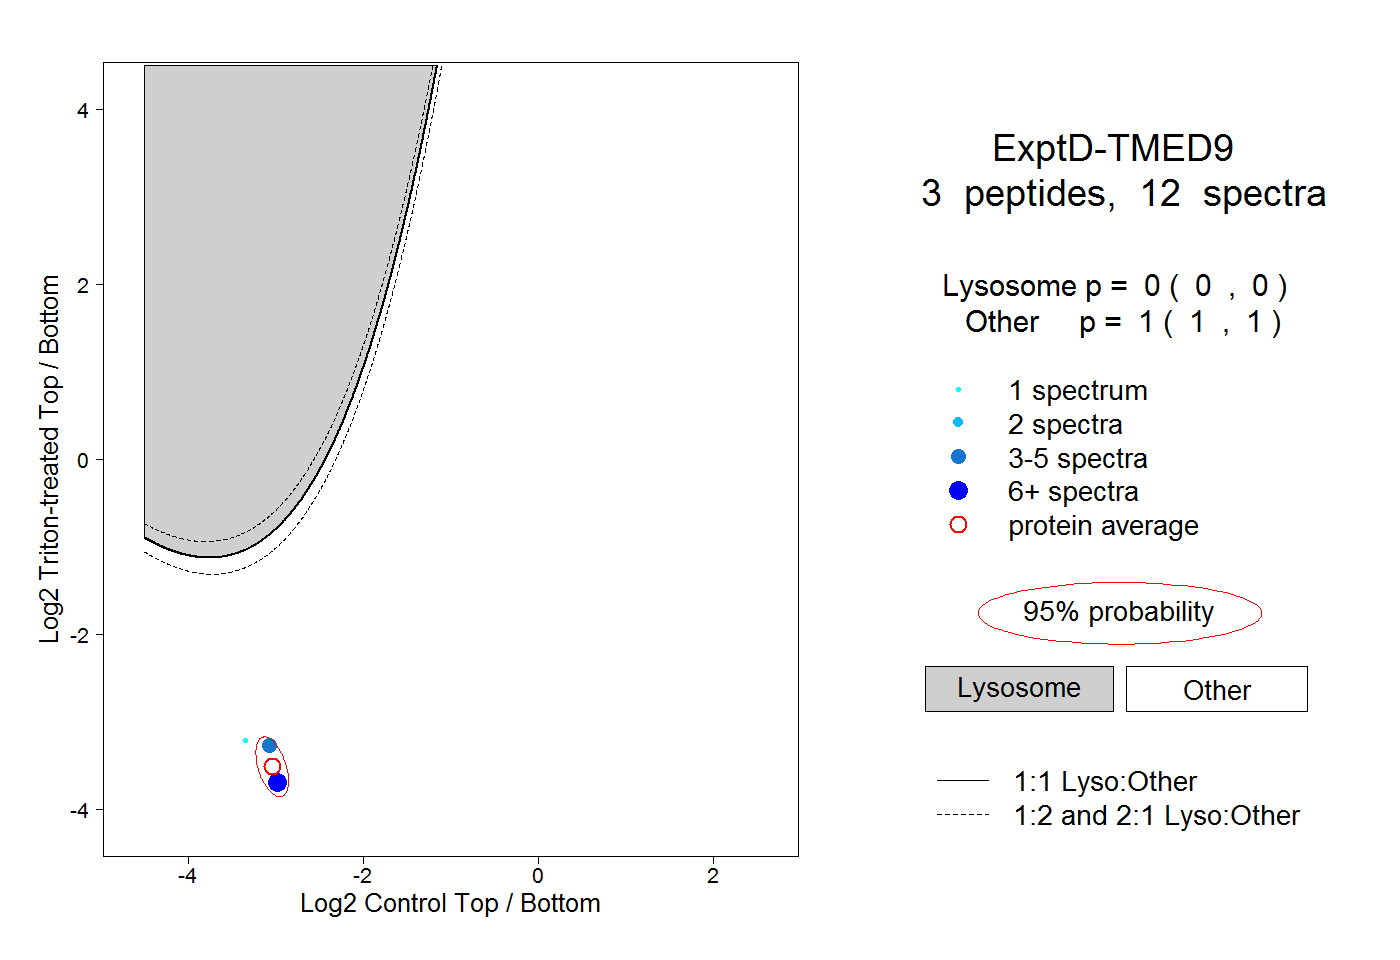 |
0.000 0.000 | 0.000 |
1.000 1.000 | 1.000 |