 31
31peptides
spectra
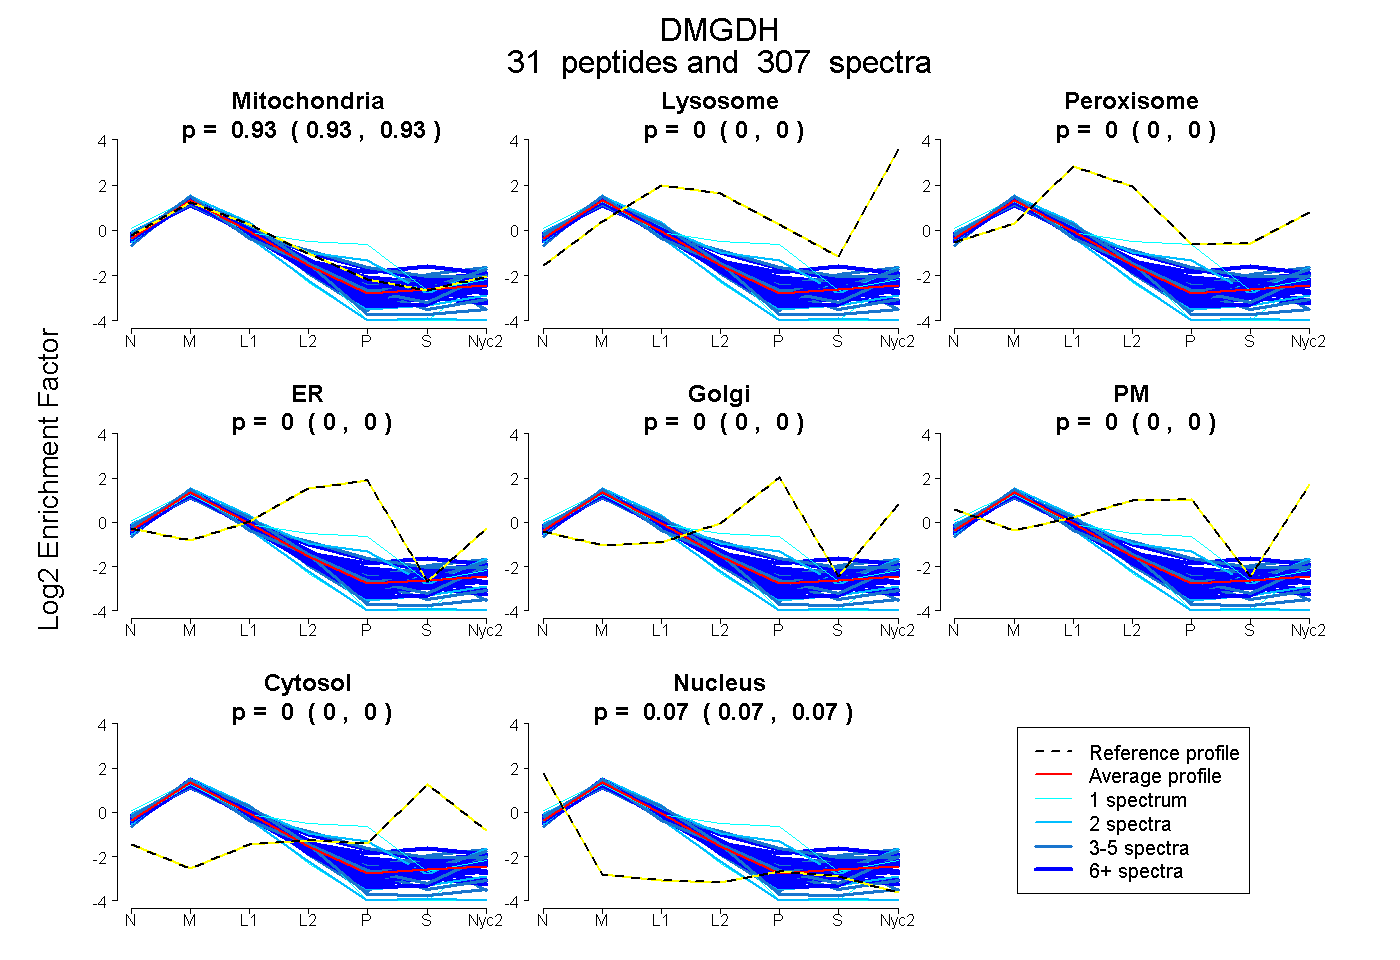
0.933 | 0.934
0.000 | 0.000
0.000 | 0.000
0.000 | 0.000
0.000 | 0.000
0.000 | 0.000
0.000 | 0.000
0.066 | 0.067
25peptides
spectra
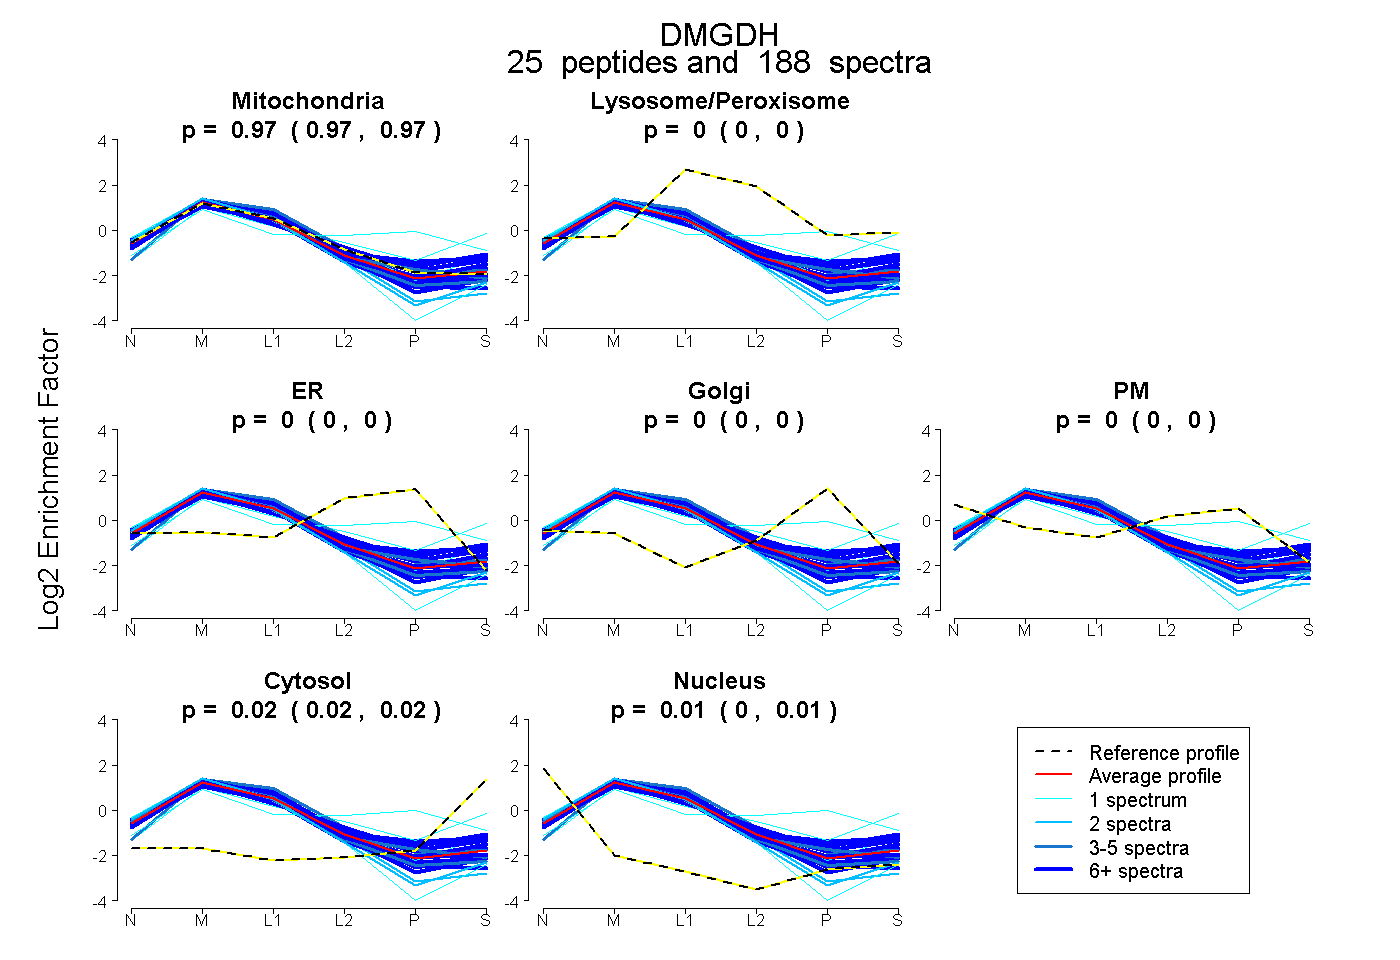
0.970 | 0.973
0.000 | 0.000
0.000 | 0.000
0.000 | 0.000
0.000 | 0.000
0.020 | 0.025
0.004 | 0.007
38peptides
spectra

0.000 | 0.000
1.000 | 1.000
21peptides
spectra
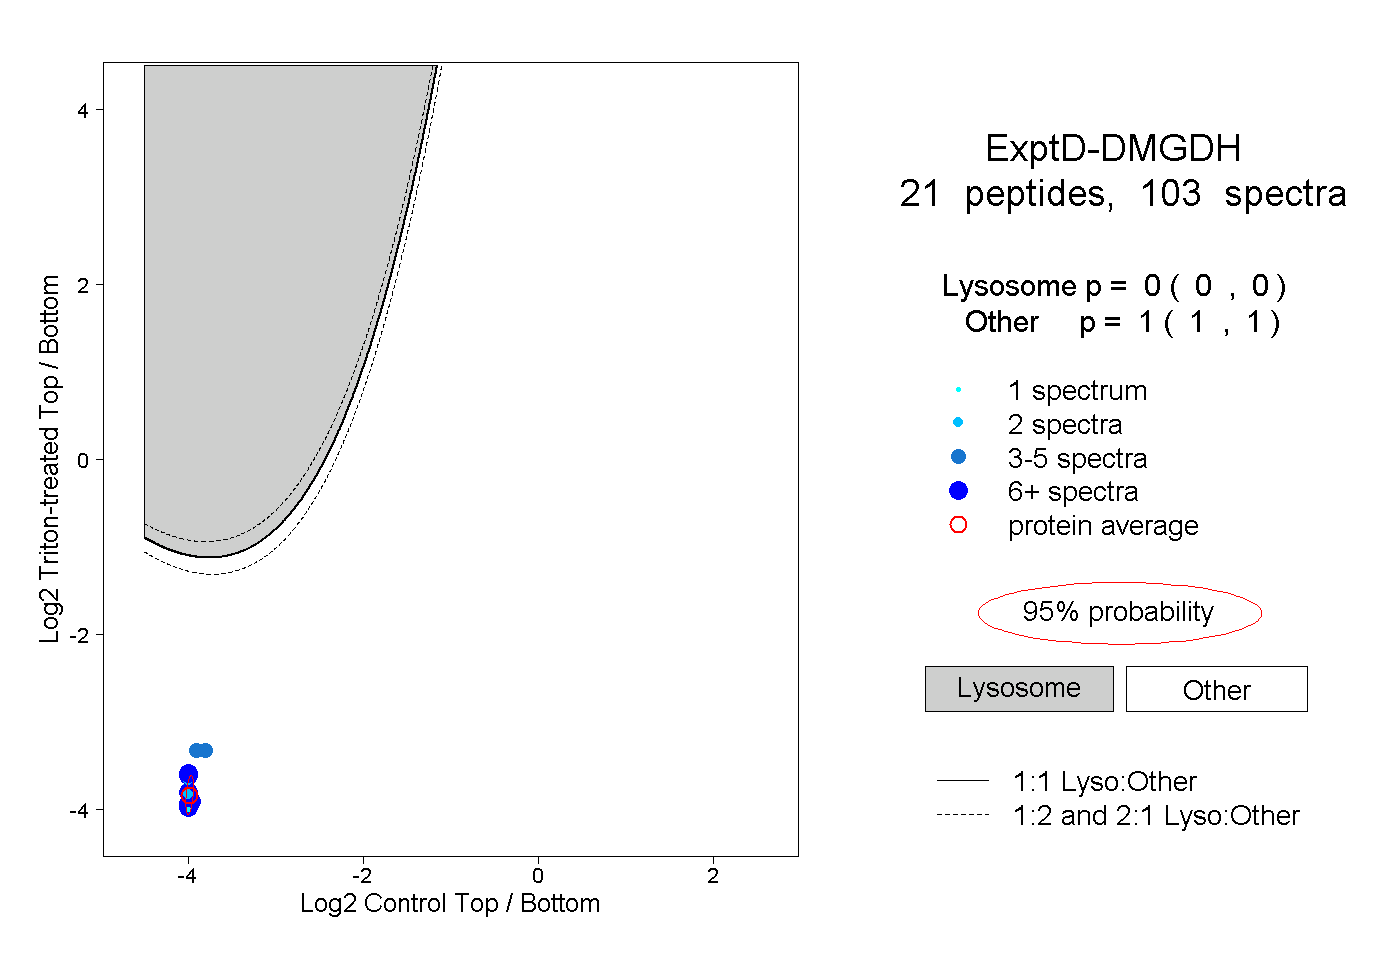
0.000 | 0.000
1.000 | 1.000