 31
31peptides
spectra
0.933 | 0.934
0.000 | 0.000
0.000 | 0.000
0.000 | 0.000
0.000 | 0.000
0.000 | 0.000
0.000 | 0.000
0.066 | 0.067
| Plot | Mito | Lyso | Perox | ER | Golgi | PM | Cytosol | Nucleus | |||||
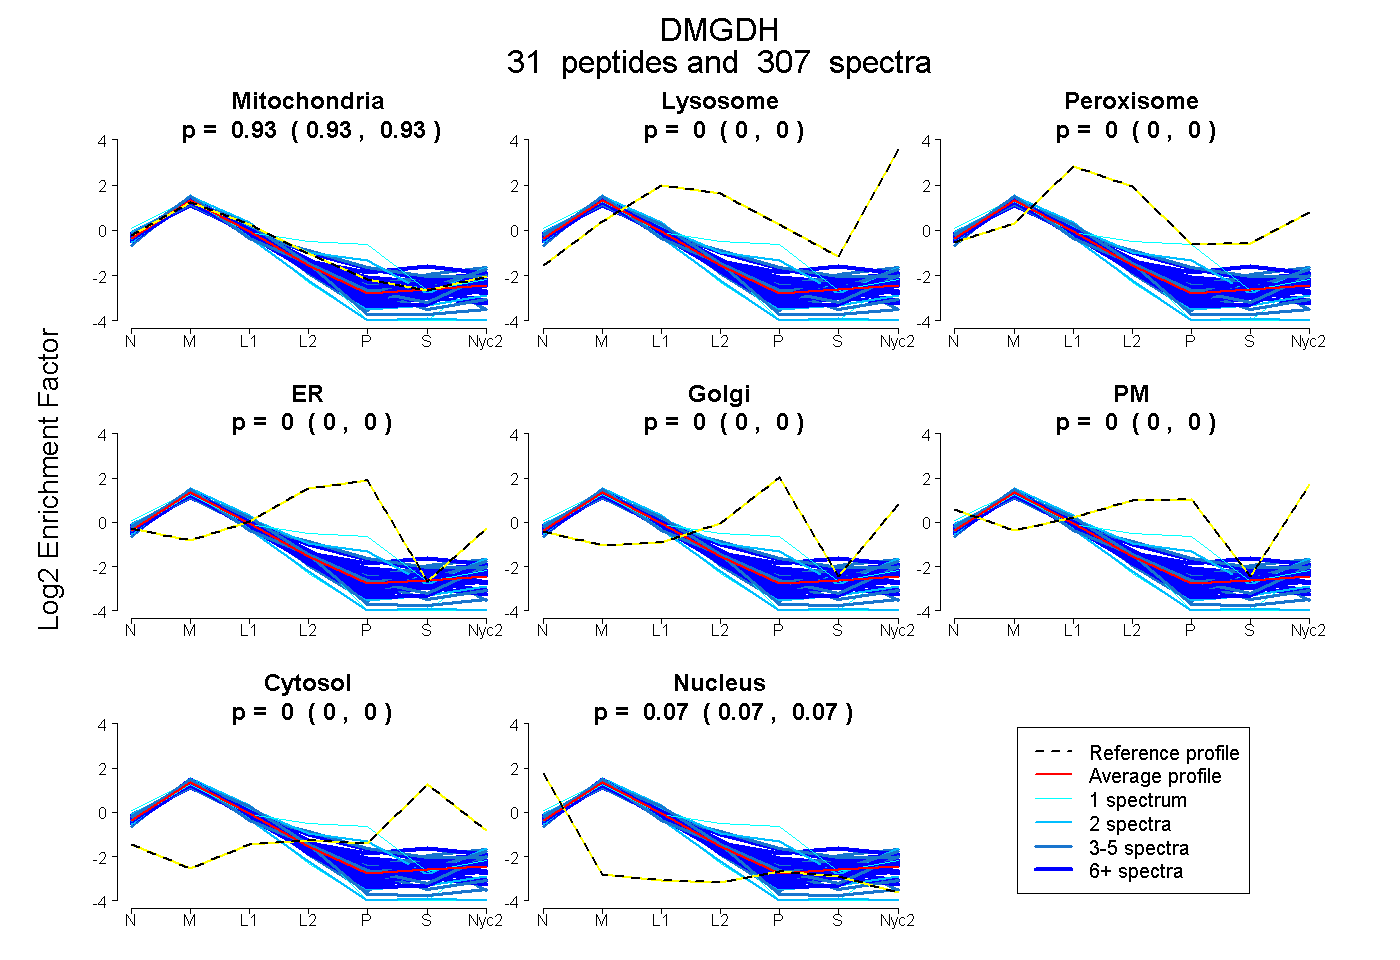
| Expt A |
31 peptides |
307 spectra |
|
0.934 0.933 | 0.934 |
0.000 0.000 | 0.000 |
0.000 0.000 | 0.000 |
0.000 0.000 | 0.000 |
0.000 0.000 | 0.000 |
0.000 0.000 | 0.000 |
0.000 0.000 | 0.000 |
0.066 0.066 | 0.067 |
| 4 spectra, VIGNTTSGSYSYSIQK | 0.975 | 0.000 | 0.000 | 0.000 | 0.000 | 0.000 | 0.000 | 0.025 | ||
| 7 spectra, ELPVLR | 0.901 | 0.000 | 0.000 | 0.000 | 0.000 | 0.000 | 0.000 | 0.099 | ||
| 15 spectra, EDSAALYER | 0.928 | 0.000 | 0.000 | 0.000 | 0.000 | 0.000 | 0.051 | 0.021 | ||
| 11 spectra, IVNAAGFWAR | 0.928 | 0.000 | 0.000 | 0.000 | 0.000 | 0.000 | 0.000 | 0.072 | ||
| 8 spectra, NITDELGVLGVAGPYAR | 0.952 | 0.000 | 0.000 | 0.000 | 0.000 | 0.000 | 0.000 | 0.048 | ||
| 9 spectra, WIEEAAVR | 0.945 | 0.000 | 0.000 | 0.000 | 0.000 | 0.000 | 0.000 | 0.055 | ||
| 3 spectra, WTTTQYTEAK | 0.870 | 0.000 | 0.000 | 0.000 | 0.000 | 0.000 | 0.000 | 0.130 | ||
| 4 spectra, TNWFEPVGSEYK | 0.958 | 0.000 | 0.000 | 0.000 | 0.000 | 0.000 | 0.001 | 0.041 | ||
| 19 spectra, ISDIPVTAIR | 0.927 | 0.000 | 0.000 | 0.000 | 0.000 | 0.000 | 0.000 | 0.073 | ||
| 5 spectra, ITEHVEAAMEMVPVLK | 0.850 | 0.000 | 0.000 | 0.062 | 0.000 | 0.000 | 0.086 | 0.003 | ||
| 48 spectra, FAGRPTQR | 0.935 | 0.000 | 0.000 | 0.000 | 0.000 | 0.000 | 0.000 | 0.065 | ||
| 10 spectra, ISYTGELGWELYHR | 0.883 | 0.003 | 0.000 | 0.000 | 0.053 | 0.000 | 0.061 | 0.000 | ||
| 1 spectrum, EGQESPPSPPEWK | 0.860 | 0.000 | 0.000 | 0.000 | 0.000 | 0.000 | 0.000 | 0.140 | ||
| 16 spectra, GGYDVEIR | 0.844 | 0.000 | 0.000 | 0.000 | 0.000 | 0.000 | 0.156 | 0.000 | ||
| 5 spectra, IHYDSIK | 0.920 | 0.000 | 0.000 | 0.000 | 0.000 | 0.000 | 0.033 | 0.048 | ||
| 2 spectra, GQDSTQLLDHLCANVIPK | 0.957 | 0.000 | 0.000 | 0.000 | 0.000 | 0.000 | 0.000 | 0.043 | ||
| 26 spectra, ELFESDLDR | 0.893 | 0.000 | 0.000 | 0.000 | 0.000 | 0.000 | 0.000 | 0.107 | ||
| 9 spectra, LATTPER | 0.915 | 0.000 | 0.000 | 0.000 | 0.000 | 0.000 | 0.016 | 0.069 | ||
| 13 spectra, LEEETGQVVGFHQPGSIR | 0.961 | 0.000 | 0.000 | 0.000 | 0.000 | 0.000 | 0.031 | 0.009 | ||
| 17 spectra, LTSEDLSDDVFK | 0.904 | 0.000 | 0.000 | 0.000 | 0.000 | 0.000 | 0.000 | 0.096 | ||
| 9 spectra, VGVIDLSPFGK | 0.916 | 0.000 | 0.000 | 0.000 | 0.000 | 0.000 | 0.000 | 0.084 | ||
| 2 spectra, SSQGRPSSAGLR | 0.853 | 0.000 | 0.000 | 0.007 | 0.118 | 0.021 | 0.000 | 0.000 | ||
| 2 spectra, VSGLYK | 0.820 | 0.000 | 0.000 | 0.000 | 0.000 | 0.000 | 0.000 | 0.180 | ||
| 1 spectrum, YGALLK | 0.755 | 0.000 | 0.000 | 0.245 | 0.000 | 0.000 | 0.000 | 0.000 | ||
| 5 spectra, IHELFPLLNMDK | 0.922 | 0.000 | 0.000 | 0.000 | 0.000 | 0.000 | 0.000 | 0.078 | ||
| 1 spectrum, AWGSEMNCDTNPLEAGLDYFIK | 0.857 | 0.000 | 0.000 | 0.000 | 0.000 | 0.000 | 0.000 | 0.143 | ||
| 4 spectra, ESYGFNNIVGYPK | 0.913 | 0.000 | 0.000 | 0.000 | 0.000 | 0.000 | 0.021 | 0.066 | ||
| 5 spectra, DGLLFGPYESQEK | 0.849 | 0.000 | 0.000 | 0.000 | 0.000 | 0.000 | 0.000 | 0.151 | ||
| 12 spectra, DLEGSYYLR | 0.929 | 0.000 | 0.000 | 0.000 | 0.000 | 0.000 | 0.000 | 0.071 | ||
| 3 spectra, DVVLLEK | 0.916 | 0.000 | 0.000 | 0.000 | 0.000 | 0.000 | 0.058 | 0.026 | ||
| 31 spectra, VGFTNISHMLTPR | 0.945 | 0.000 | 0.000 | 0.000 | 0.000 | 0.000 | 0.000 | 0.055 |
| Plot | Mito | Lyso or Perox | ER | Golgi | PM | Cytosol | Nucleus | ||||||
| Expt B |
25 peptides |
188 spectra |
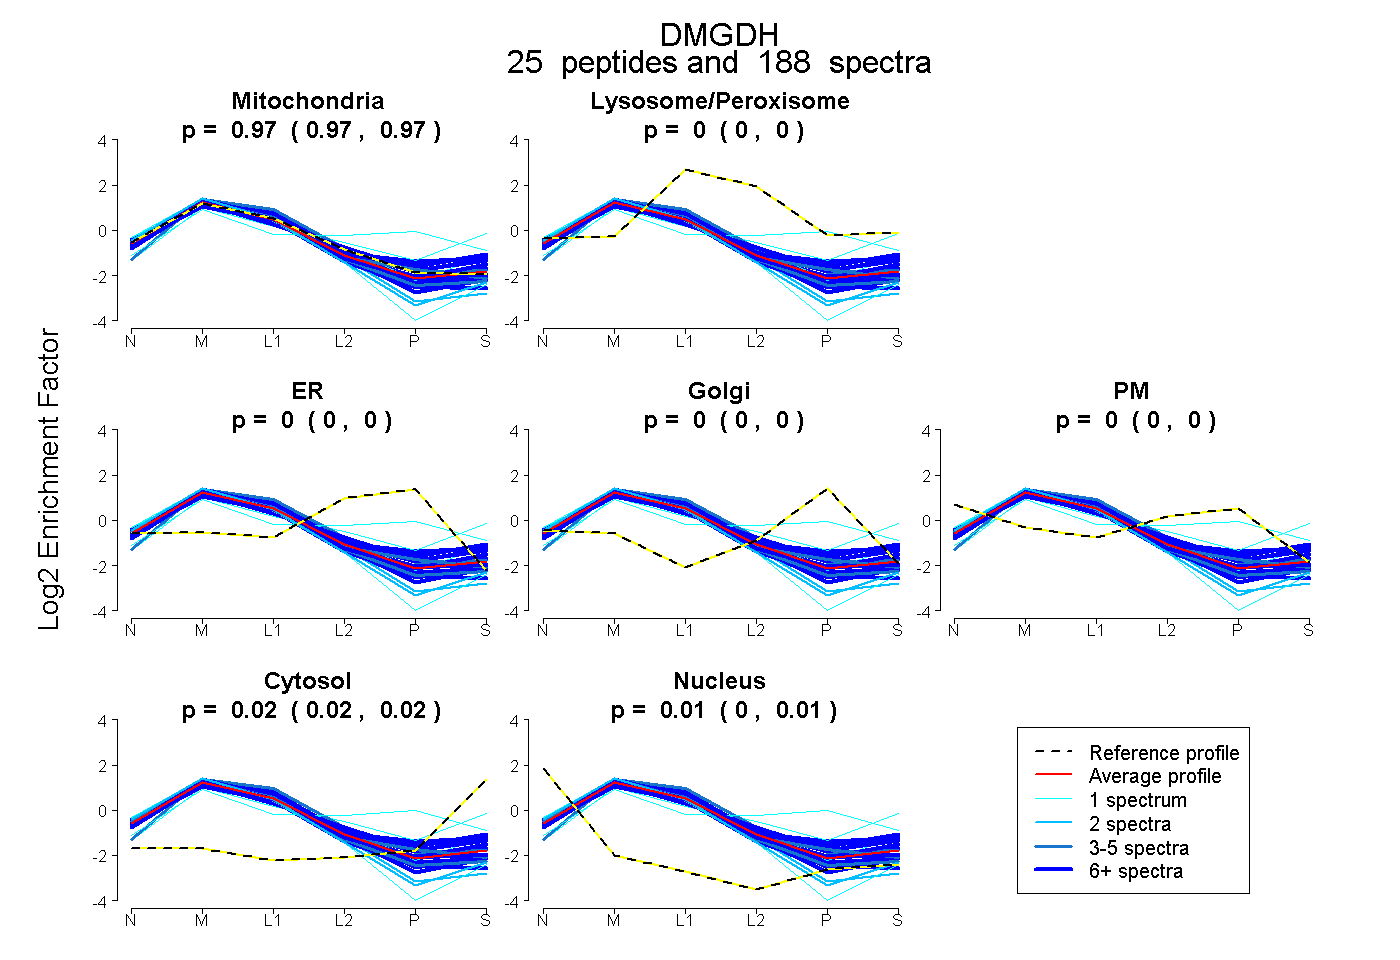 |
0.972 0.970 | 0.973 |
0.000 0.000 | 0.000 |
0.000 0.000 | 0.000 |
0.000 0.000 | 0.000 |
0.000 0.000 | 0.000 |
0.023 0.020 | 0.025 |
0.006 0.004 | 0.007 |
|||
| Plot | Lyso | Other | |||||||||||
| Expt C |
38 peptides |
1039 spectra |
 |
0.000 0.000 | 0.000 |
1.000 1.000 | 1.000 |
||||||||
| Plot | Lyso | Other | |||||||||||
| Expt D |
21 peptides |
103 spectra |
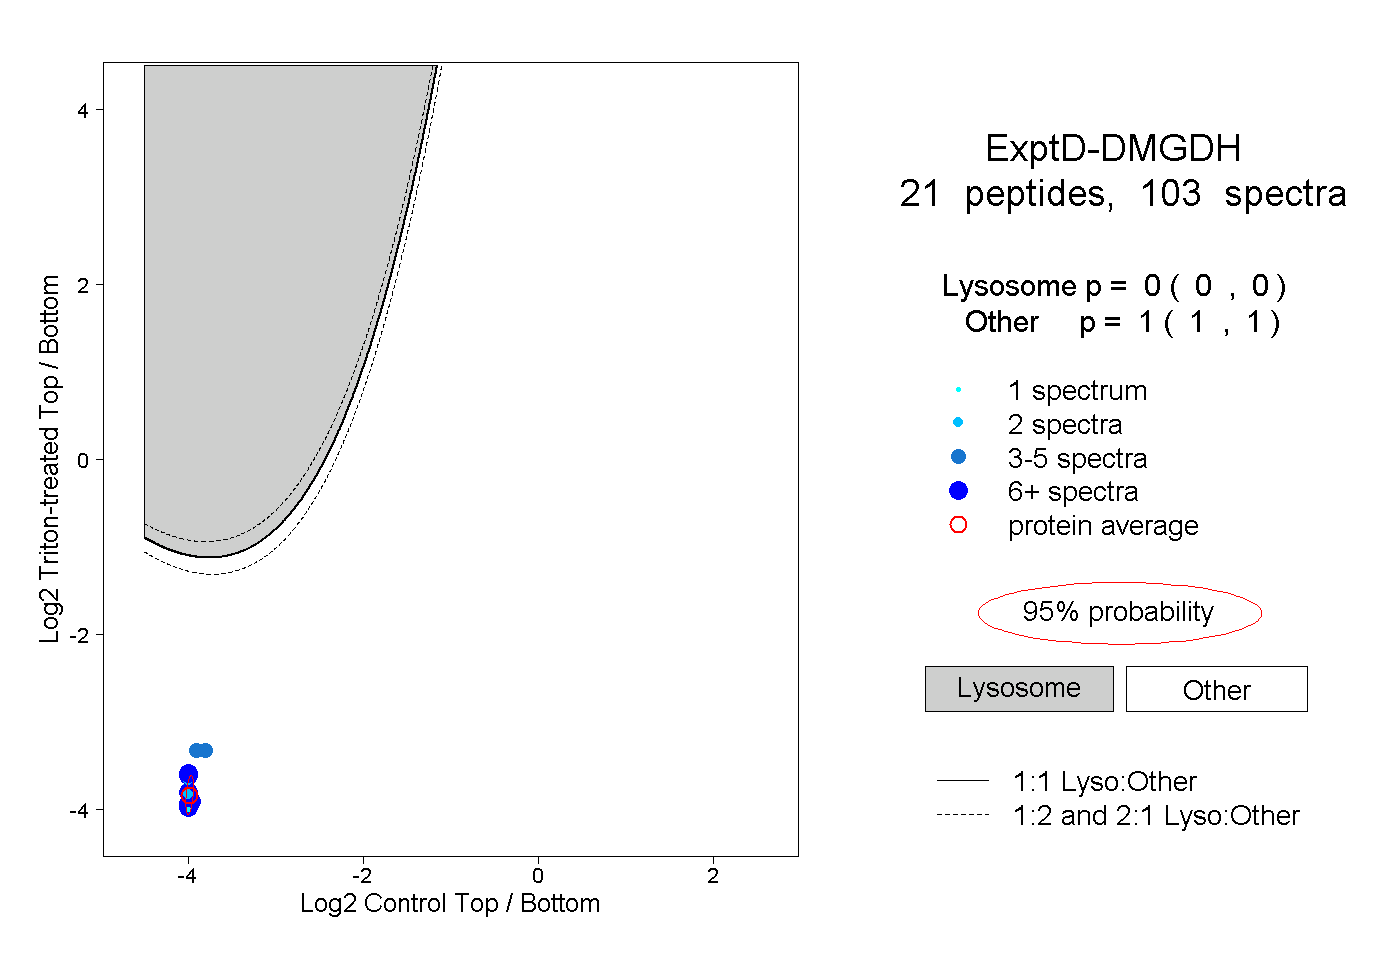 |
0.000 0.000 | 0.000 |
1.000 1.000 | 1.000 |