 44
44peptides
spectra
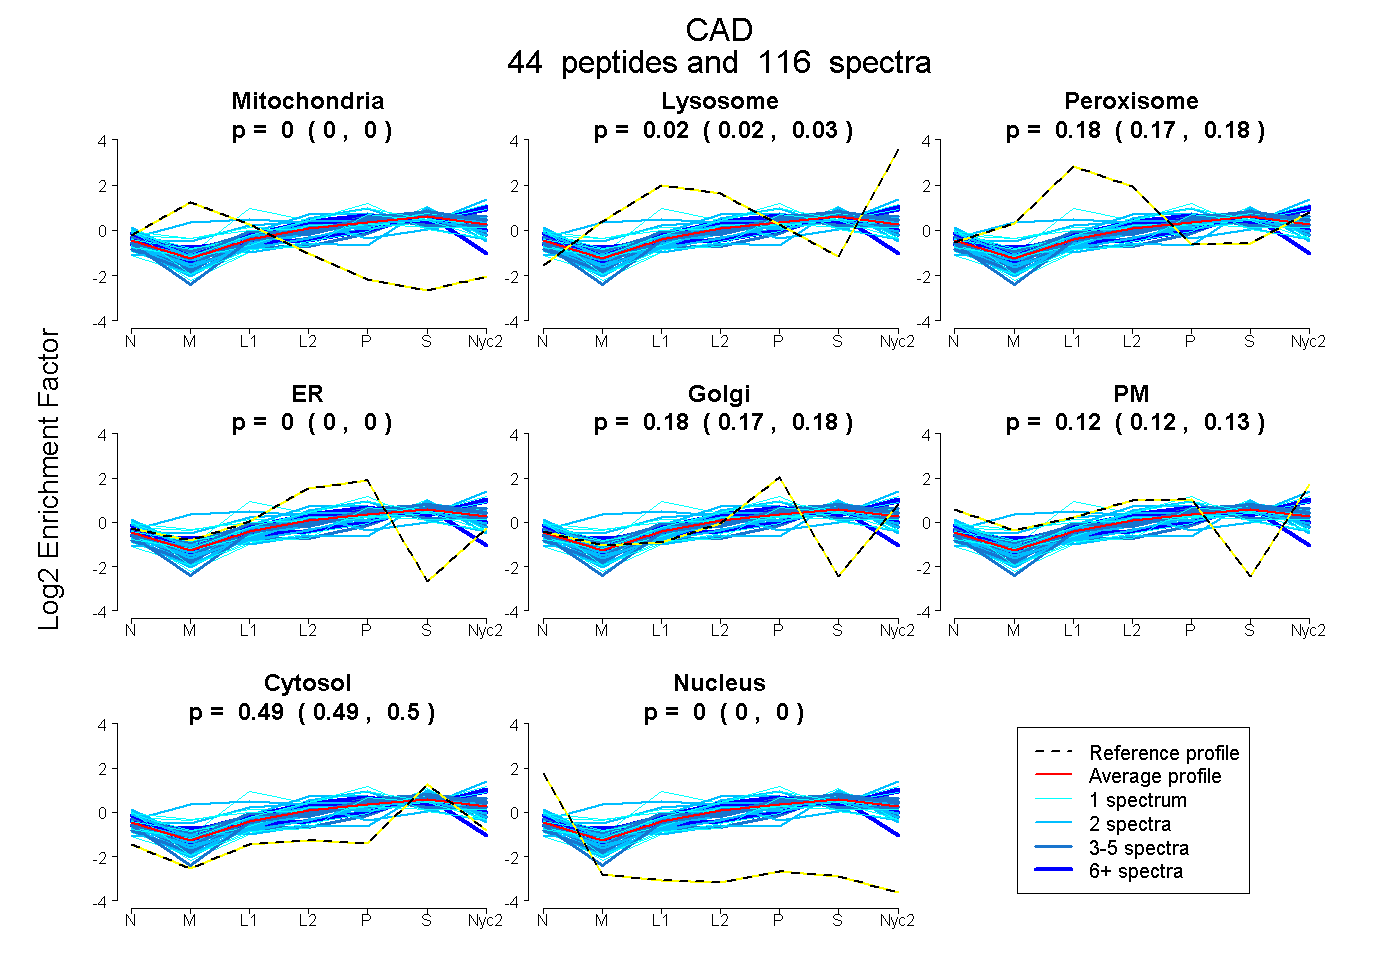
0.000 | 0.000
0.019 | 0.027
0.174 | 0.184
0.000 | 0.000
0.173 | 0.185
0.117 | 0.131
0.491 | 0.495
0.000 | 0.000
15peptides
spectra
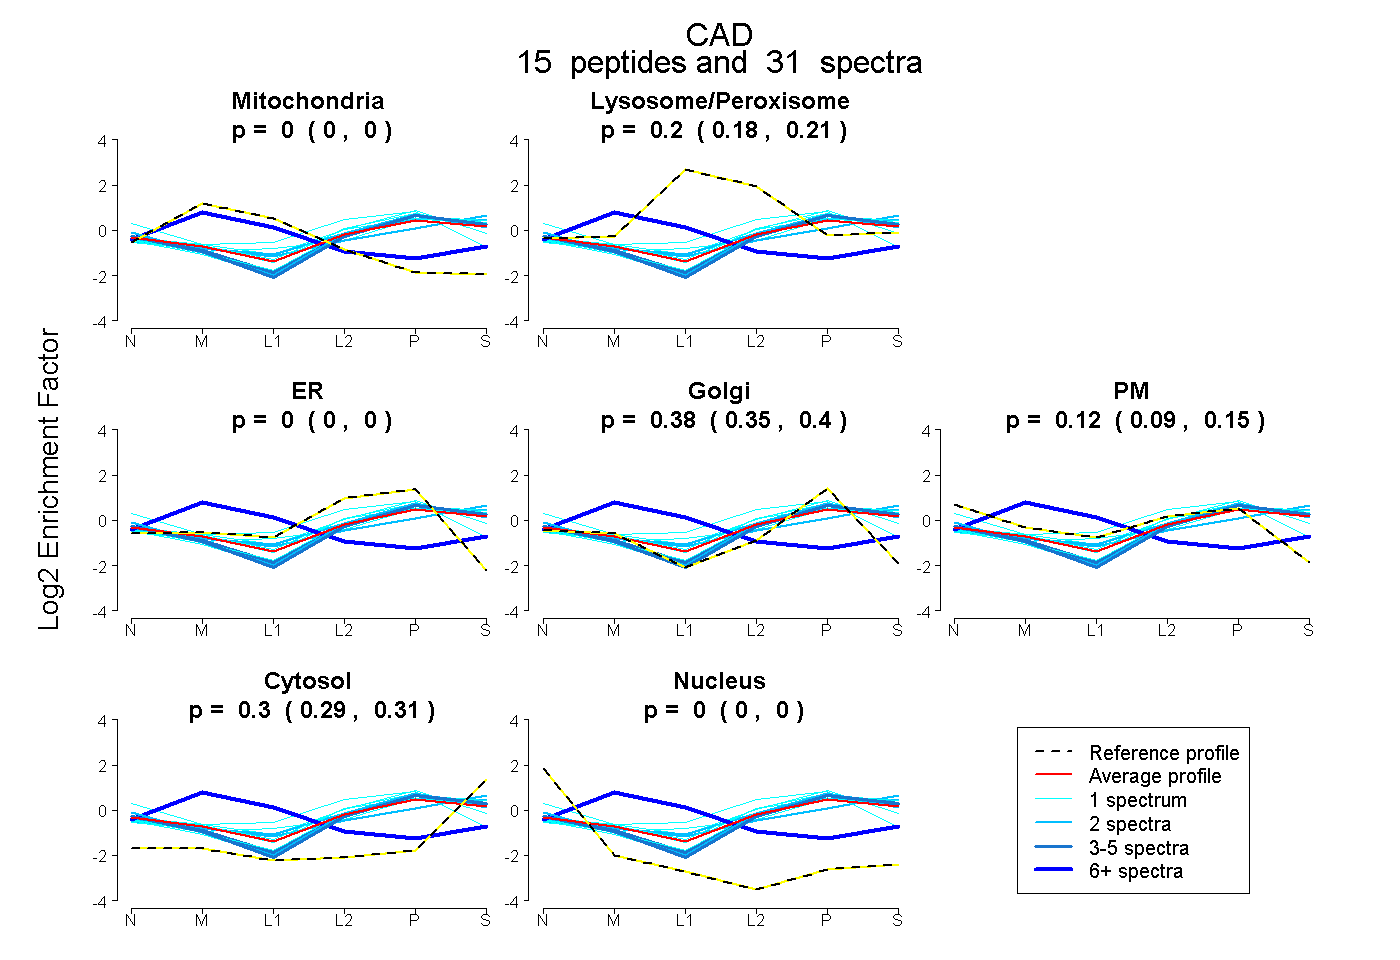
0.000 | 0.000
0.182 | 0.209
0.000 | 0.000
0.348 | 0.403
0.092 | 0.147
0.291 | 0.312
0.000 | 0.000
28peptides
spectra
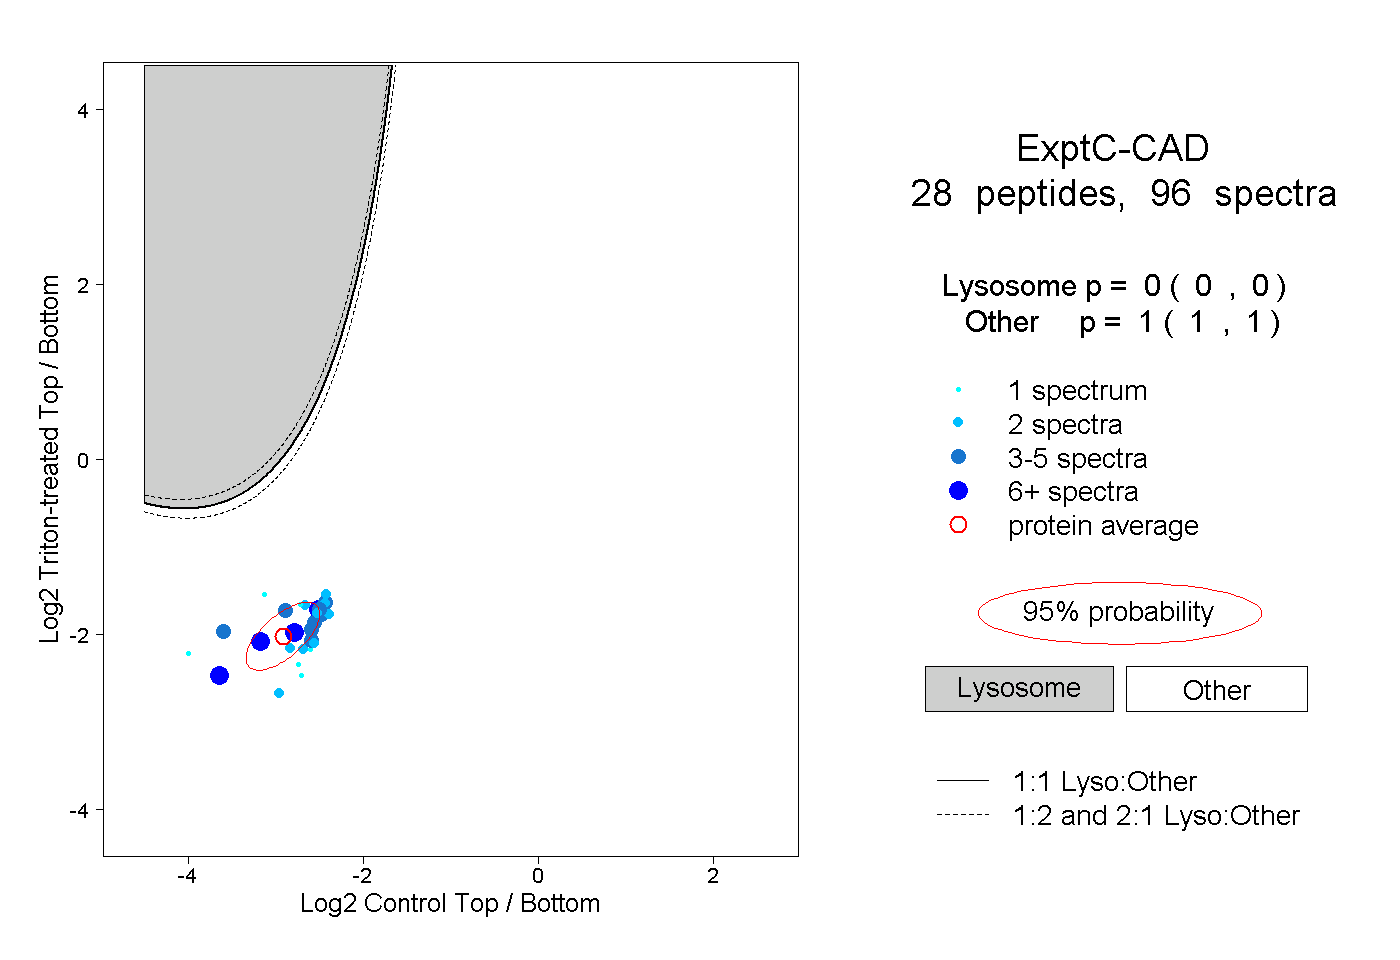
0.000 | 0.000
1.000 | 1.000
7peptides
spectra
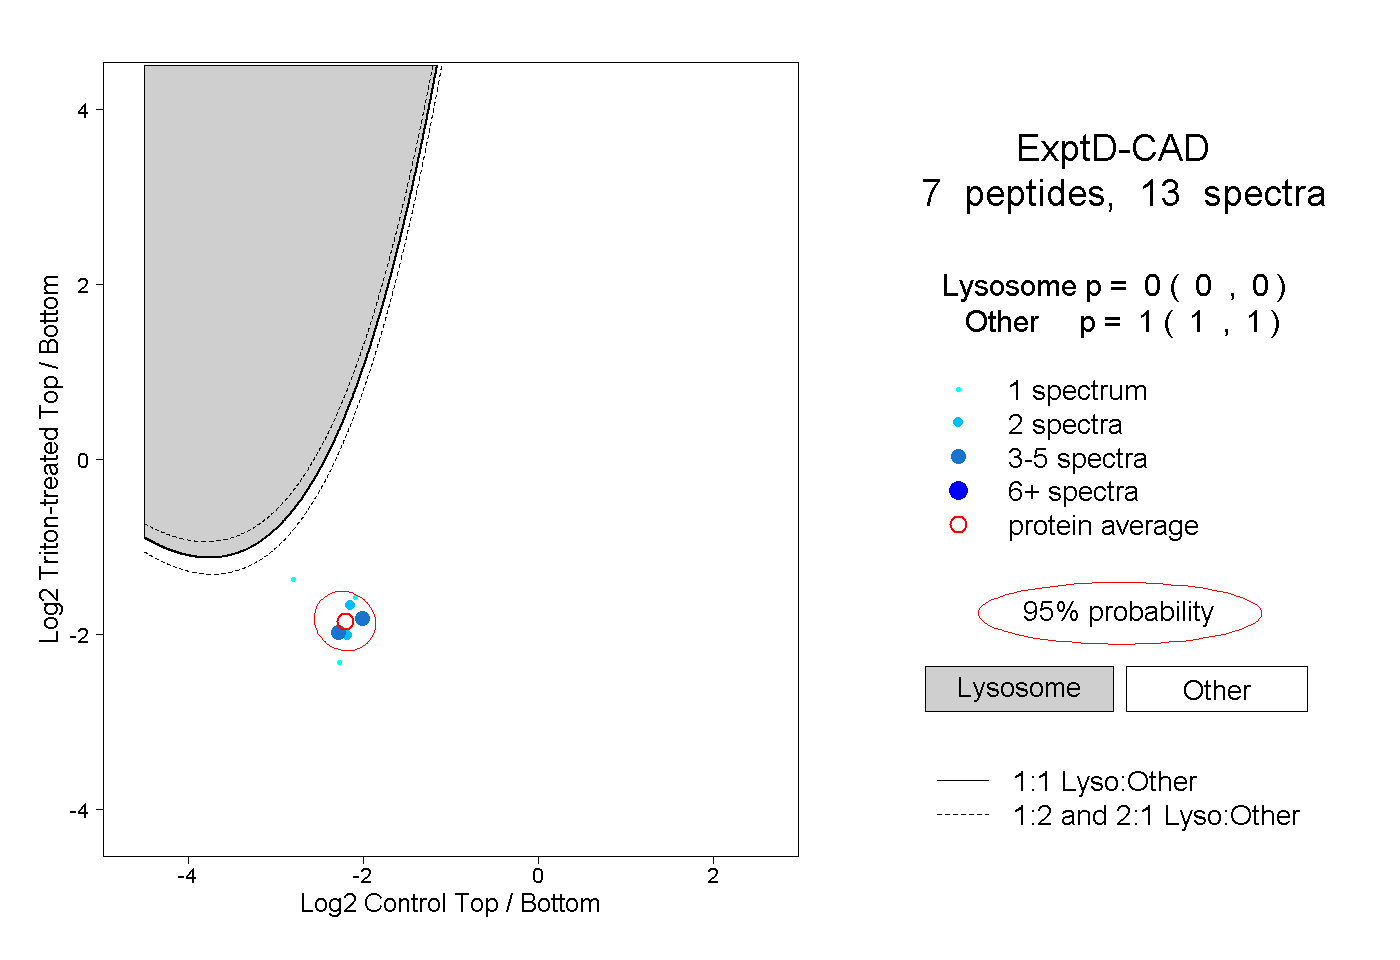
0.000 | 0.000
1.000 | 1.000