 44
44peptides
spectra
0.000 | 0.000
0.019 | 0.027
0.174 | 0.184
0.000 | 0.000
0.173 | 0.185
0.117 | 0.131
0.491 | 0.495
0.000 | 0.000
| Plot | Mito | Lyso | Perox | ER | Golgi | PM | Cytosol | Nucleus | |||||
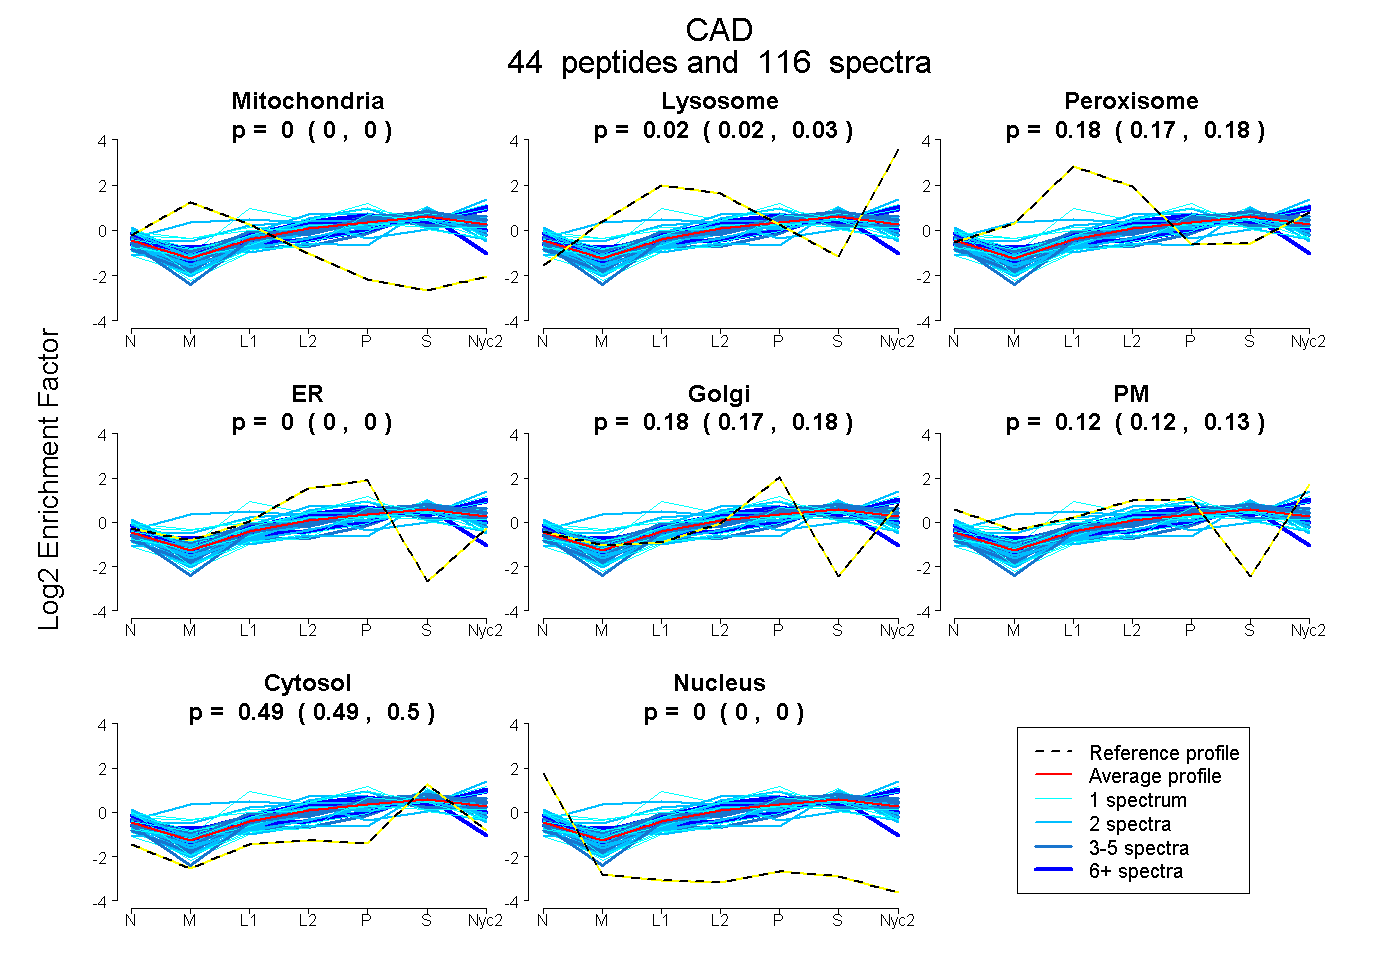
| Expt A |
44 peptides |
116 spectra |
|
0.000 0.000 | 0.000 |
0.023 0.019 | 0.027 |
0.179 0.174 | 0.184 |
0.000 0.000 | 0.000 |
0.180 0.173 | 0.185 |
0.124 0.117 | 0.131 |
0.493 0.491 | 0.495 |
0.000 0.000 | 0.000 |
| 1 spectrum, QAENGMYIR | 0.000 | 0.180 | 0.014 | 0.000 | 0.000 | 0.367 | 0.439 | 0.000 | ||
| 3 spectra, TPHVLVLGSGVYR | 0.000 | 0.000 | 0.256 | 0.000 | 0.329 | 0.044 | 0.371 | 0.000 | ||
| 1 spectrum, QELGICPAVK | 0.000 | 0.070 | 0.004 | 0.126 | 0.056 | 0.000 | 0.744 | 0.000 | ||
| 1 spectrum, YVAPPSLR | 0.000 | 0.000 | 0.000 | 0.063 | 0.270 | 0.090 | 0.577 | 0.000 | ||
| 6 spectra, TSSSFAAAMAR | 0.000 | 0.132 | 0.039 | 0.000 | 0.000 | 0.381 | 0.449 | 0.000 | ||
| 1 spectrum, HPQPGAVELAAK | 0.008 | 0.000 | 0.361 | 0.000 | 0.162 | 0.085 | 0.384 | 0.000 | ||
| 3 spectra, VIPGLPDGR | 0.000 | 0.107 | 0.186 | 0.000 | 0.234 | 0.000 | 0.473 | 0.000 | ||
| 11 spectra, MVVMHPMPR | 0.000 | 0.204 | 0.049 | 0.000 | 0.099 | 0.255 | 0.393 | 0.000 | ||
| 1 spectrum, VESVGLMTGSGVVGVK | 0.000 | 0.134 | 0.008 | 0.000 | 0.000 | 0.381 | 0.477 | 0.000 | ||
| 2 spectra, LLEQHR | 0.000 | 0.165 | 0.000 | 0.132 | 0.077 | 0.067 | 0.560 | 0.000 | ||
| 4 spectra, LSLDDLLQR | 0.000 | 0.128 | 0.091 | 0.000 | 0.031 | 0.215 | 0.535 | 0.000 | ||
| 2 spectra, NSVTGGTAAFEPSLDYCVVK | 0.133 | 0.148 | 0.297 | 0.000 | 0.000 | 0.138 | 0.285 | 0.000 | ||
| 1 spectrum, TVHSLACLLTQYR | 0.000 | 0.000 | 0.144 | 0.373 | 0.122 | 0.000 | 0.361 | 0.000 | ||
| 4 spectra, MPSSVWDFVASR | 0.000 | 0.207 | 0.000 | 0.180 | 0.061 | 0.000 | 0.551 | 0.000 | ||
| 8 spectra, IDCWFLHR | 0.000 | 0.000 | 0.118 | 0.320 | 0.000 | 0.000 | 0.561 | 0.000 | ||
| 2 spectra, CLGFSDK | 0.000 | 0.000 | 0.184 | 0.182 | 0.095 | 0.039 | 0.499 | 0.000 | ||
| 2 spectra, GHNQPCLLVGTGR | 0.000 | 0.000 | 0.007 | 0.000 | 0.000 | 0.418 | 0.574 | 0.000 | ||
| 1 spectrum, VNEISVEVDSDPR | 0.020 | 0.000 | 0.273 | 0.000 | 0.139 | 0.207 | 0.362 | 0.000 | ||
| 2 spectra, ELSDLESAR | 0.000 | 0.118 | 0.000 | 0.123 | 0.046 | 0.093 | 0.620 | 0.000 | ||
| 2 spectra, LHHNPR | 0.000 | 0.004 | 0.149 | 0.000 | 0.000 | 0.377 | 0.469 | 0.000 | ||
| 2 spectra, CLCQLGAEVTVVPWNHELDSR | 0.000 | 0.000 | 0.099 | 0.427 | 0.020 | 0.051 | 0.402 | 0.000 | ||
| 2 spectra, GEVRPELGSR | 0.000 | 0.000 | 0.071 | 0.083 | 0.127 | 0.119 | 0.601 | 0.000 | ||
| 5 spectra, GRPLPQDLLHQAK | 0.000 | 0.000 | 0.122 | 0.000 | 0.134 | 0.289 | 0.454 | 0.000 | ||
| 1 spectrum, FHLPPR | 0.000 | 0.000 | 0.496 | 0.000 | 0.126 | 0.000 | 0.378 | 0.000 | ||
| 1 spectrum, ATGYPLAYVAAK | 0.000 | 0.190 | 0.020 | 0.038 | 0.162 | 0.000 | 0.590 | 0.000 | ||
| 4 spectra, AQGLPVTCEVAPHHLFLNR | 0.000 | 0.000 | 0.167 | 0.000 | 0.200 | 0.000 | 0.633 | 0.000 | ||
| 2 spectra, IVTHAK | 0.000 | 0.000 | 0.145 | 0.106 | 0.111 | 0.058 | 0.580 | 0.000 | ||
| 1 spectrum, AAFALGGLGSGFASTK | 0.000 | 0.082 | 0.000 | 0.113 | 0.000 | 0.194 | 0.611 | 0.000 | ||
| 1 spectrum, VLGTSPEAIDSAENR | 0.000 | 0.192 | 0.000 | 0.117 | 0.001 | 0.130 | 0.560 | 0.000 | ||
| 2 spectra, DQMSHLFNVAHTLR | 0.000 | 0.091 | 0.306 | 0.000 | 0.206 | 0.068 | 0.329 | 0.000 | ||
| 2 spectra, DTVAGNAEGR | 0.000 | 0.117 | 0.030 | 0.112 | 0.000 | 0.202 | 0.539 | 0.000 | ||
| 2 spectra, LGYPVLVR | 0.000 | 0.147 | 0.000 | 0.103 | 0.068 | 0.052 | 0.630 | 0.000 | ||
| 1 spectrum, SLDILK | 0.000 | 0.136 | 0.106 | 0.000 | 0.157 | 0.096 | 0.505 | 0.000 | ||
| 2 spectra, VHVDCMTSQK | 0.000 | 0.000 | 0.167 | 0.130 | 0.000 | 0.215 | 0.487 | 0.000 | ||
| 3 spectra, IIMGEK | 0.000 | 0.000 | 0.155 | 0.000 | 0.142 | 0.112 | 0.591 | 0.000 | ||
| 2 spectra, SFEEAFQK | 0.059 | 0.047 | 0.117 | 0.000 | 0.078 | 0.000 | 0.699 | 0.000 | ||
| 2 spectra, TLGVDLVALATR | 0.000 | 0.112 | 0.000 | 0.095 | 0.000 | 0.222 | 0.571 | 0.000 | ||
| 2 spectra, LYLNETFSELR | 0.000 | 0.096 | 0.047 | 0.000 | 0.204 | 0.053 | 0.600 | 0.000 | ||
| 4 spectra, LALGIPLPELR | 0.000 | 0.144 | 0.000 | 0.084 | 0.000 | 0.182 | 0.589 | 0.000 | ||
| 2 spectra, VFNAGGAPR | 0.000 | 0.159 | 0.054 | 0.127 | 0.000 | 0.160 | 0.500 | 0.000 | ||
| 9 spectra, LAEAGAR | 0.000 | 0.003 | 0.213 | 0.000 | 0.190 | 0.054 | 0.540 | 0.000 | ||
| 1 spectrum, VTAVDWHFEEAVDGECPPQR | 0.000 | 0.163 | 0.063 | 0.261 | 0.075 | 0.000 | 0.438 | 0.000 | ||
| 2 spectra, MALLATVLGR | 0.000 | 0.244 | 0.000 | 0.000 | 0.000 | 0.385 | 0.371 | 0.000 | ||
| 3 spectra, VPQFSFSR | 0.000 | 0.138 | 0.000 | 0.088 | 0.123 | 0.054 | 0.597 | 0.000 |
| Plot | Mito | Lyso or Perox | ER | Golgi | PM | Cytosol | Nucleus | ||||||
| Expt B |
15 peptides |
31 spectra |
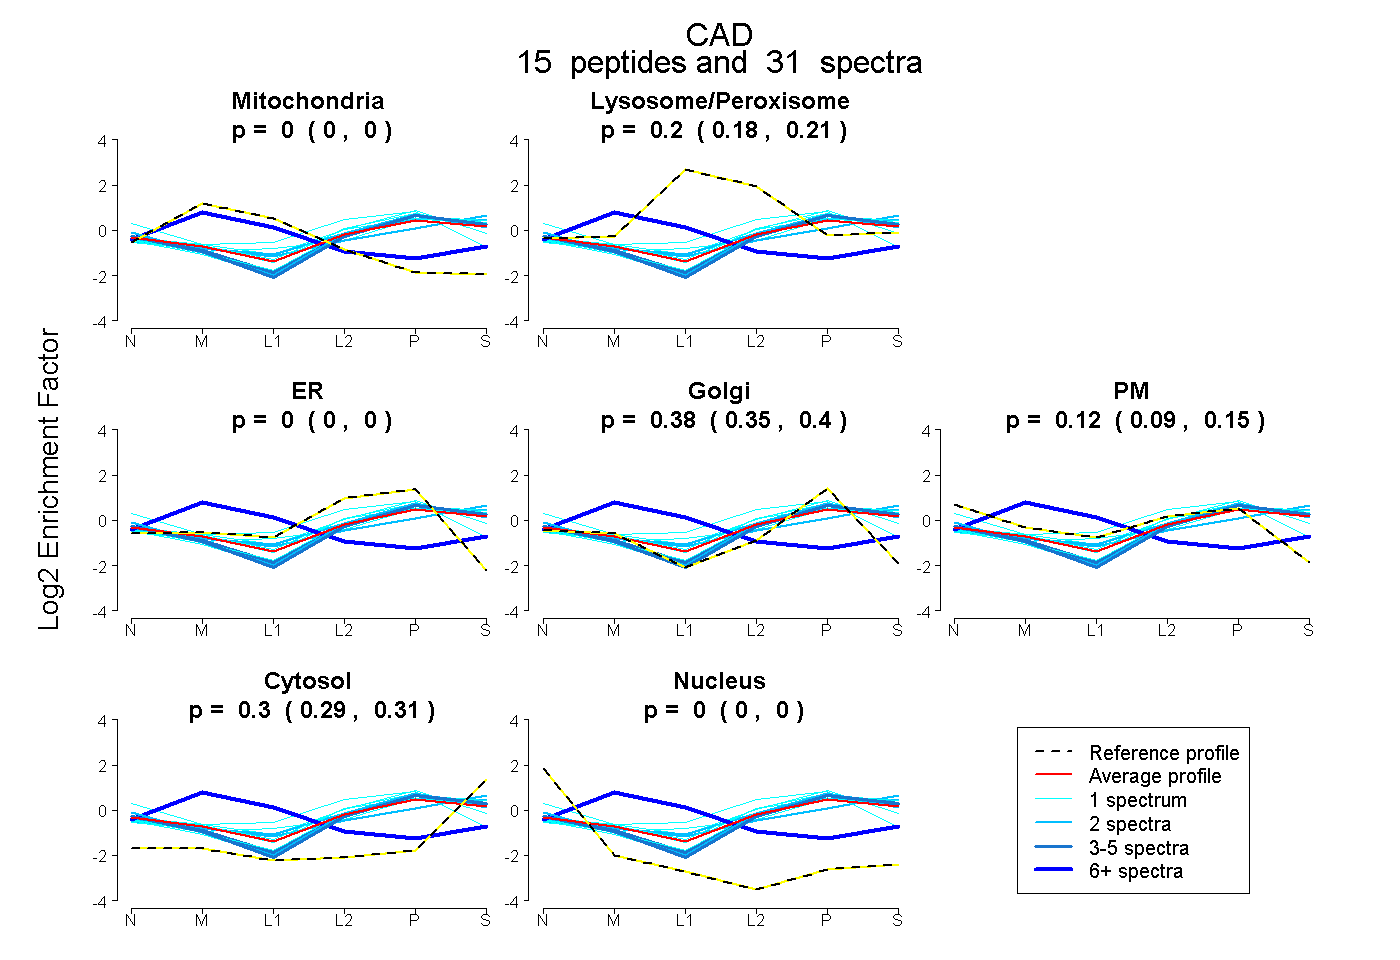 |
0.000 0.000 | 0.000 |
0.196 0.182 | 0.209 |
0.000 0.000 | 0.000 |
0.379 0.348 | 0.403 |
0.122 0.092 | 0.147 |
0.303 0.291 | 0.312 |
0.000 0.000 | 0.000 |
|||
| Plot | Lyso | Other | |||||||||||
| Expt C |
28 peptides |
96 spectra |
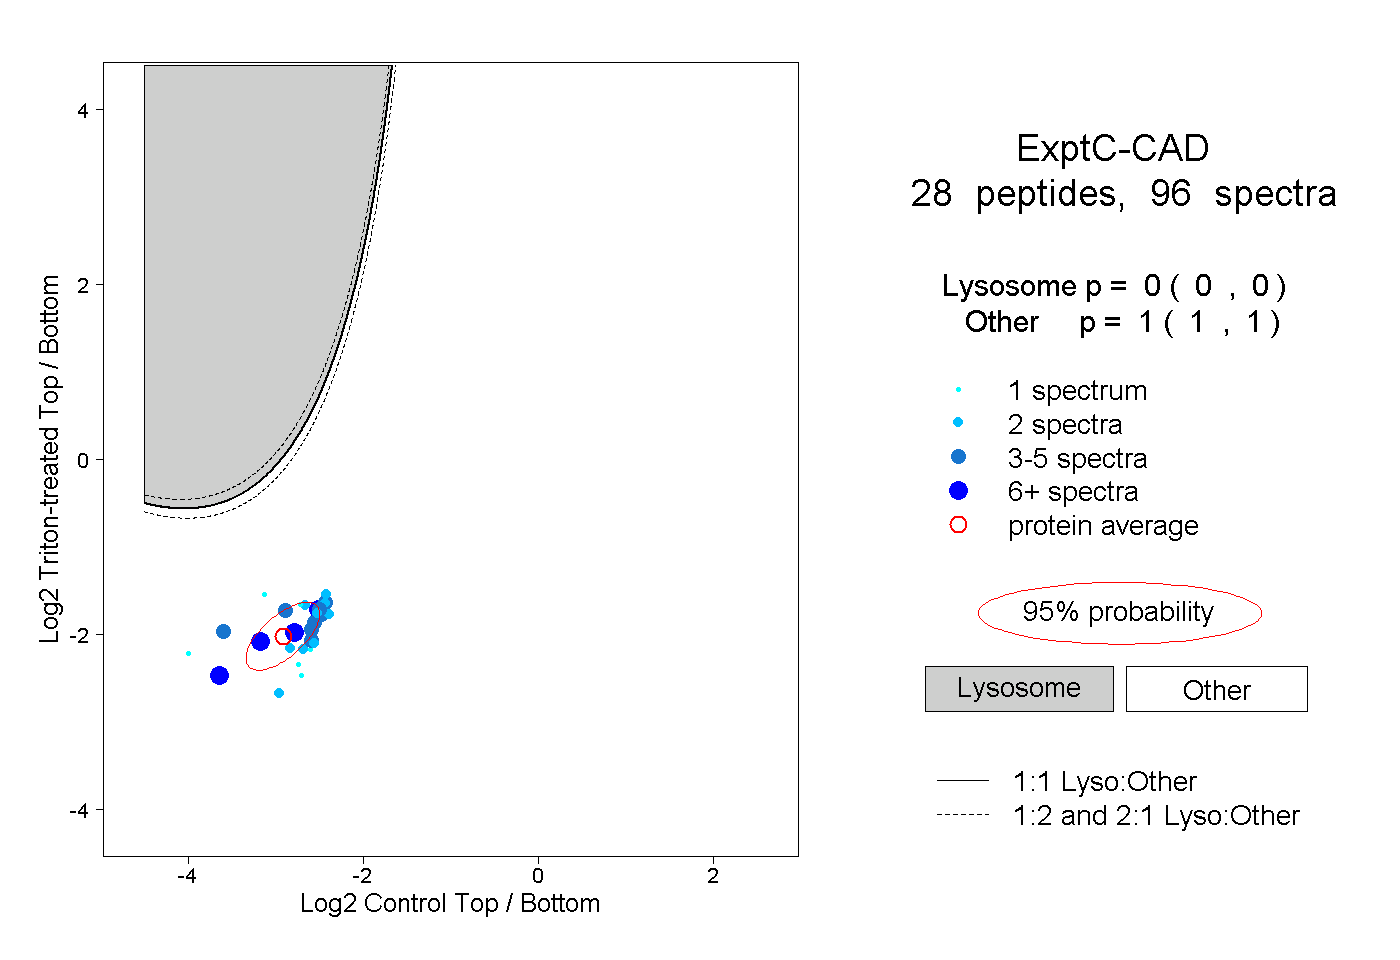 |
0.000 0.000 | 0.000 |
1.000 1.000 | 1.000 |
||||||||
| Plot | Lyso | Other | |||||||||||
| Expt D |
7 peptides |
13 spectra |
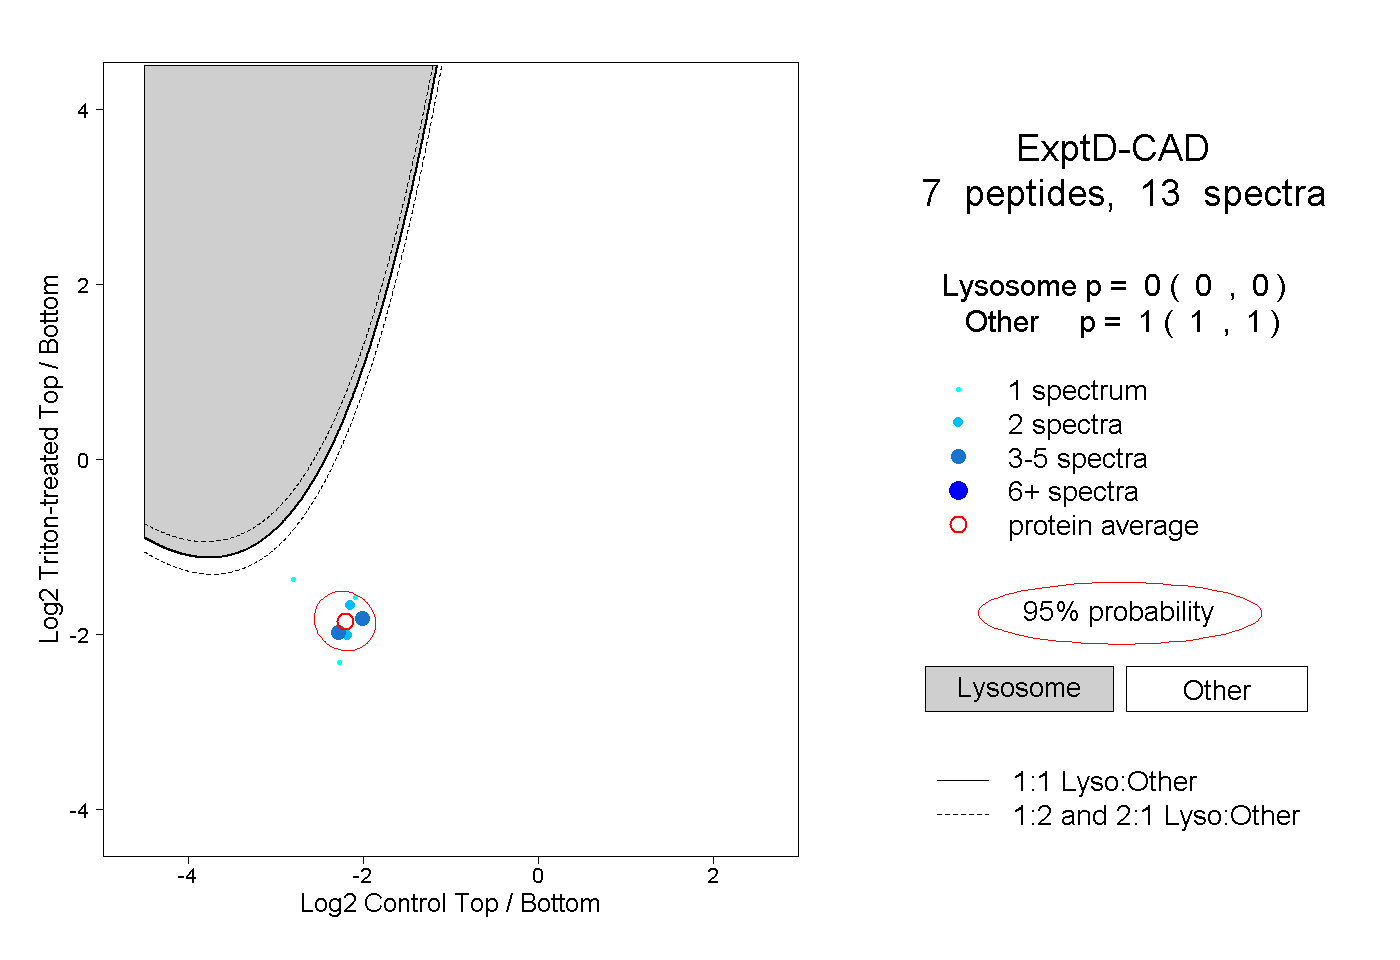 |
0.000 0.000 | 0.000 |
1.000 1.000 | 1.000 |