 9
9peptides
spectra
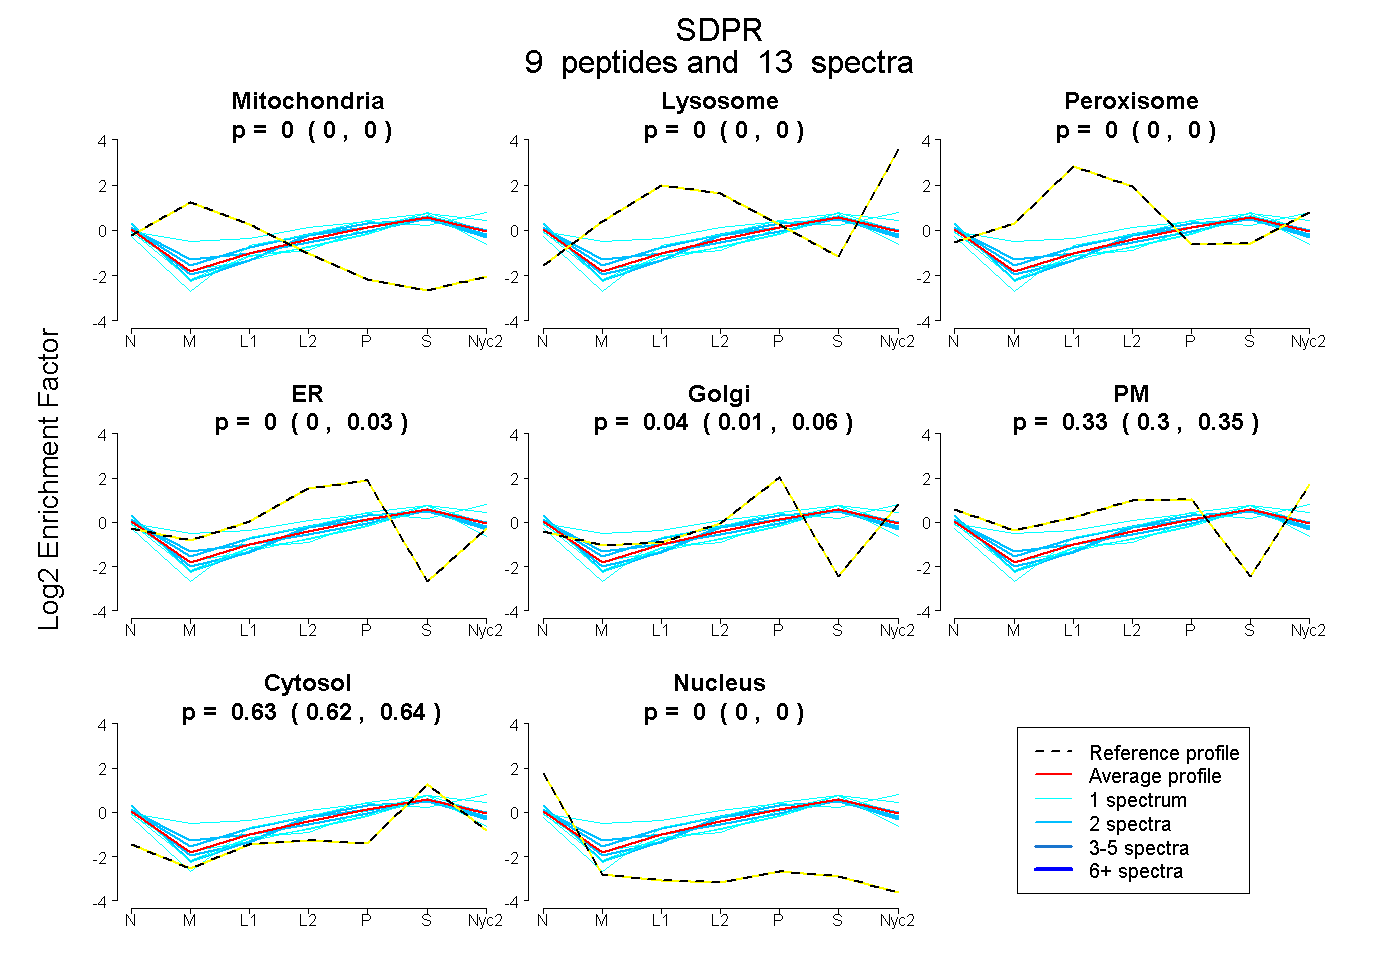
0.000 | 0.000
0.000 | 0.000
0.000 | 0.000
0.000 | 0.026
0.008 | 0.056
0.302 | 0.349
0.624 | 0.638
0.000 | 0.000
3peptides
spectra
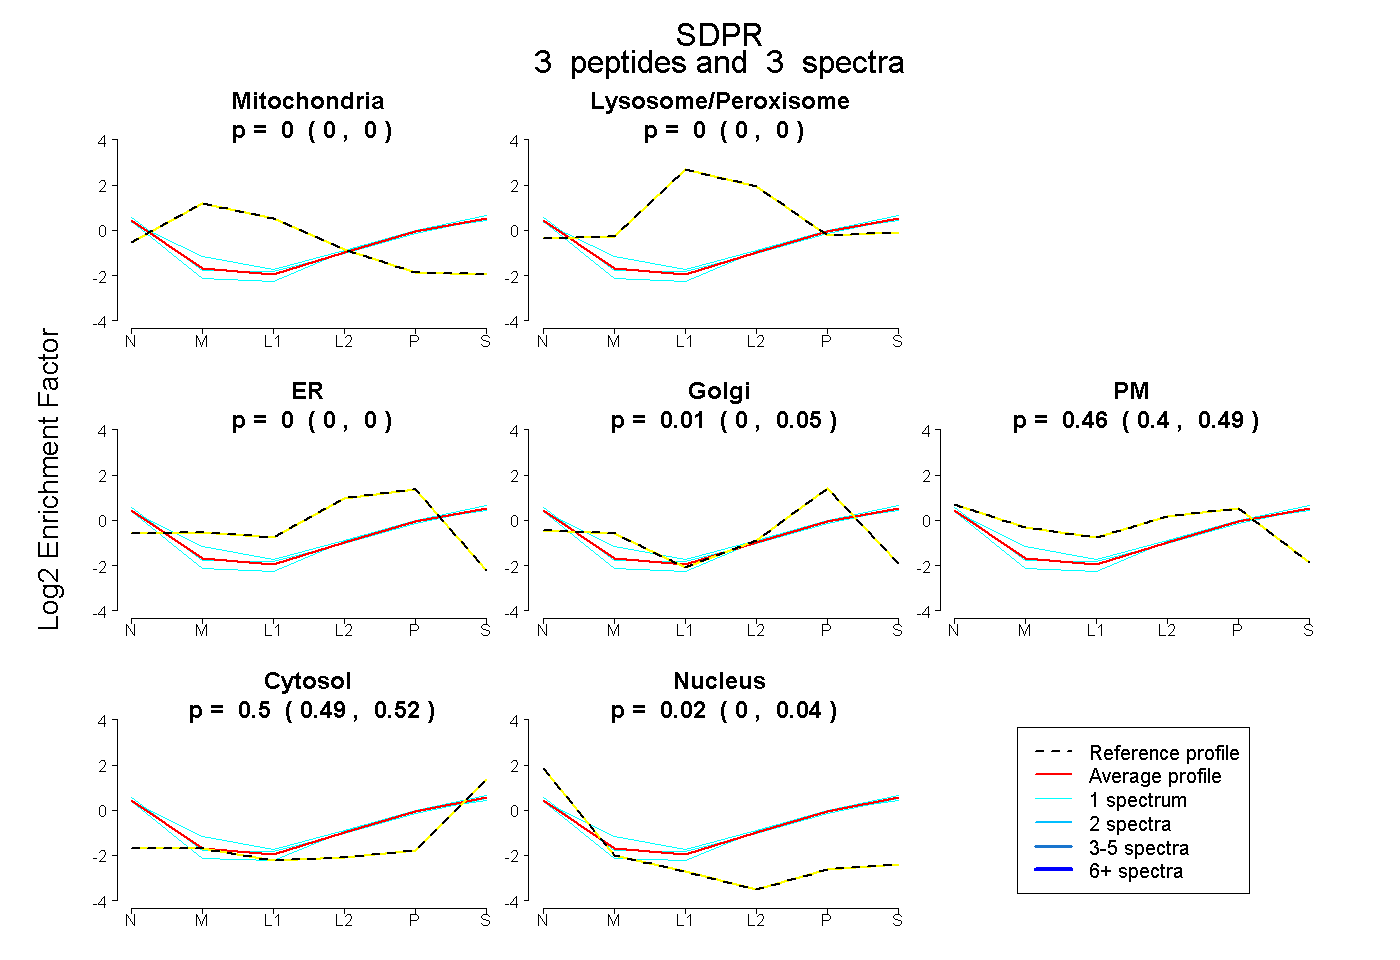
0.000 | 0.000
0.000 | 0.000
0.000 | 0.000
0.000 | 0.051
0.404 | 0.489
0.486 | 0.519
0.004 | 0.040
11peptides
spectra

0.000 | 0.000
1.000 | 1.000
2peptides
spectra

0.000 | 0.001
0.999 | 1.000