 9
9peptides
spectra
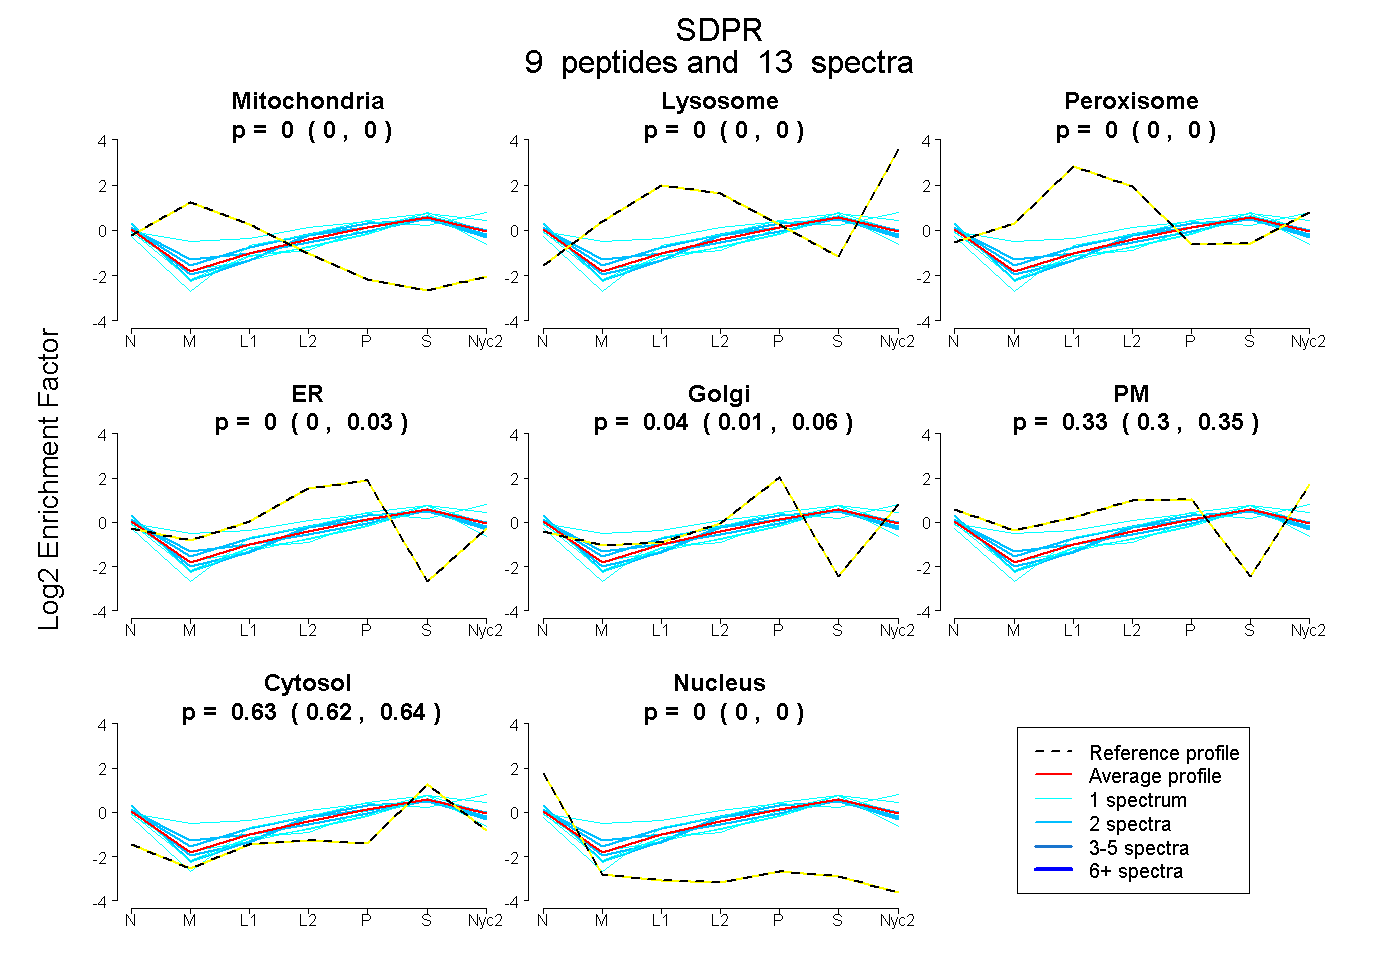
0.000 | 0.000
0.000 | 0.000
0.000 | 0.000
0.000 | 0.026
0.008 | 0.056
0.302 | 0.349
0.624 | 0.638
0.000 | 0.000
| Plot | Mito | Lyso | Perox | ER | Golgi | PM | Cytosol | Nucleus | |||||
| Expt A |
9 peptides |
13 spectra |
|
0.000 0.000 | 0.000 |
0.000 0.000 | 0.000 |
0.000 0.000 | 0.000 |
0.000 0.000 | 0.026 |
0.038 0.008 | 0.056 |
0.330 0.302 | 0.349 |
0.631 0.624 | 0.638 |
0.000 0.000 | 0.000 |
| 1 spectrum, HVQAAVLHVDQTA | 0.000 | 0.075 | 0.074 | 0.000 | 0.000 | 0.438 | 0.413 | 0.000 | ||
| 1 spectrum, GIQNDLTK | 0.000 | 0.000 | 0.000 | 0.000 | 0.046 | 0.259 | 0.695 | 0.000 | ||
| 1 spectrum, EPVPSTAEGK | 0.000 | 0.000 | 0.000 | 0.053 | 0.159 | 0.076 | 0.686 | 0.026 | ||
| 1 spectrum, VSPLSFGR | 0.000 | 0.010 | 0.000 | 0.000 | 0.083 | 0.281 | 0.626 | 0.000 | ||
| 2 spectra, DNSQVNAVTVHTLLDK | 0.000 | 0.000 | 0.000 | 0.054 | 0.023 | 0.277 | 0.627 | 0.020 | ||
| 1 spectrum, YQASTSNTVSK | 0.000 | 0.000 | 0.000 | 0.000 | 0.000 | 0.299 | 0.664 | 0.037 | ||
| 2 spectra, ELADENK | 0.000 | 0.000 | 0.009 | 0.128 | 0.000 | 0.282 | 0.581 | 0.000 | ||
| 2 spectra, ENQHNMEQR | 0.000 | 0.000 | 0.000 | 0.026 | 0.000 | 0.334 | 0.622 | 0.018 | ||
| 2 spectra, LVNMLDAVR | 0.000 | 0.000 | 0.000 | 0.000 | 0.072 | 0.297 | 0.632 | 0.000 |
| Plot | Mito | Lyso or Perox | ER | Golgi | PM | Cytosol | Nucleus | ||||||
| Expt B |
3 peptides |
3 spectra |
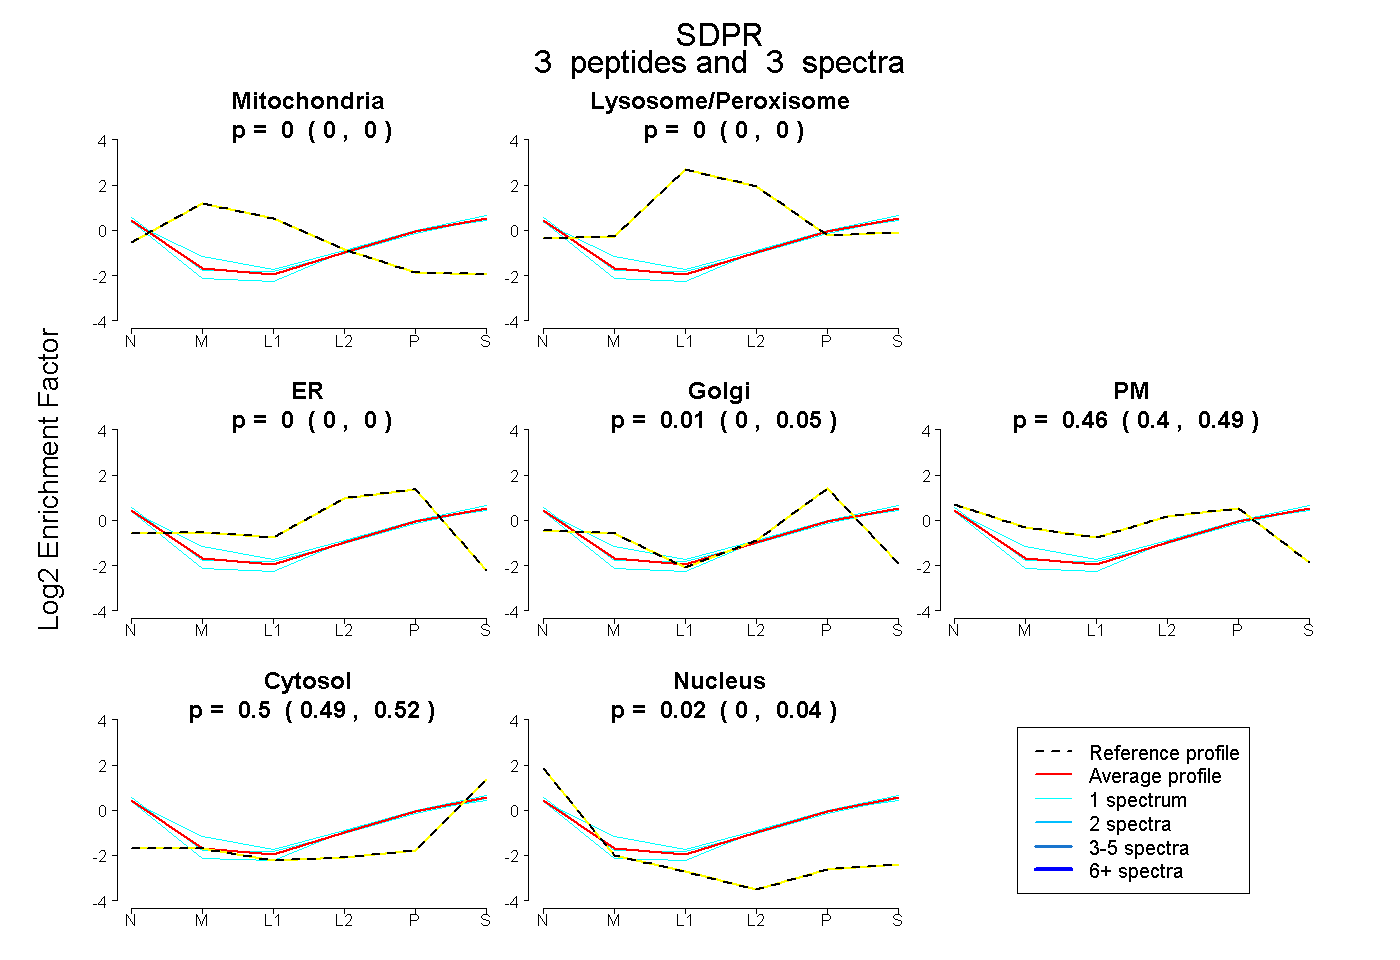 |
0.000 0.000 | 0.000 |
0.000 0.000 | 0.000 |
0.000 0.000 | 0.000 |
0.010 0.000 | 0.051 |
0.462 0.404 | 0.489 |
0.504 0.486 | 0.519 |
0.024 0.004 | 0.040 |
|||
| Plot | Lyso | Other | |||||||||||
| Expt C |
11 peptides |
29 spectra |
 |
0.000 0.000 | 0.000 |
1.000 1.000 | 1.000 |
||||||||
| Plot | Lyso | Other | |||||||||||
| Expt D |
2 peptides |
3 spectra |
 |
0.001 0.000 | 0.001 |
0.999 0.999 | 1.000 |