 6
6peptides
spectra
0.000 | 0.030
0.000 | 0.000
0.000 | 0.074
0.344 | 0.435
0.000 | 0.000
0.000 | 0.000
0.241 | 0.334
0.241 | 0.326
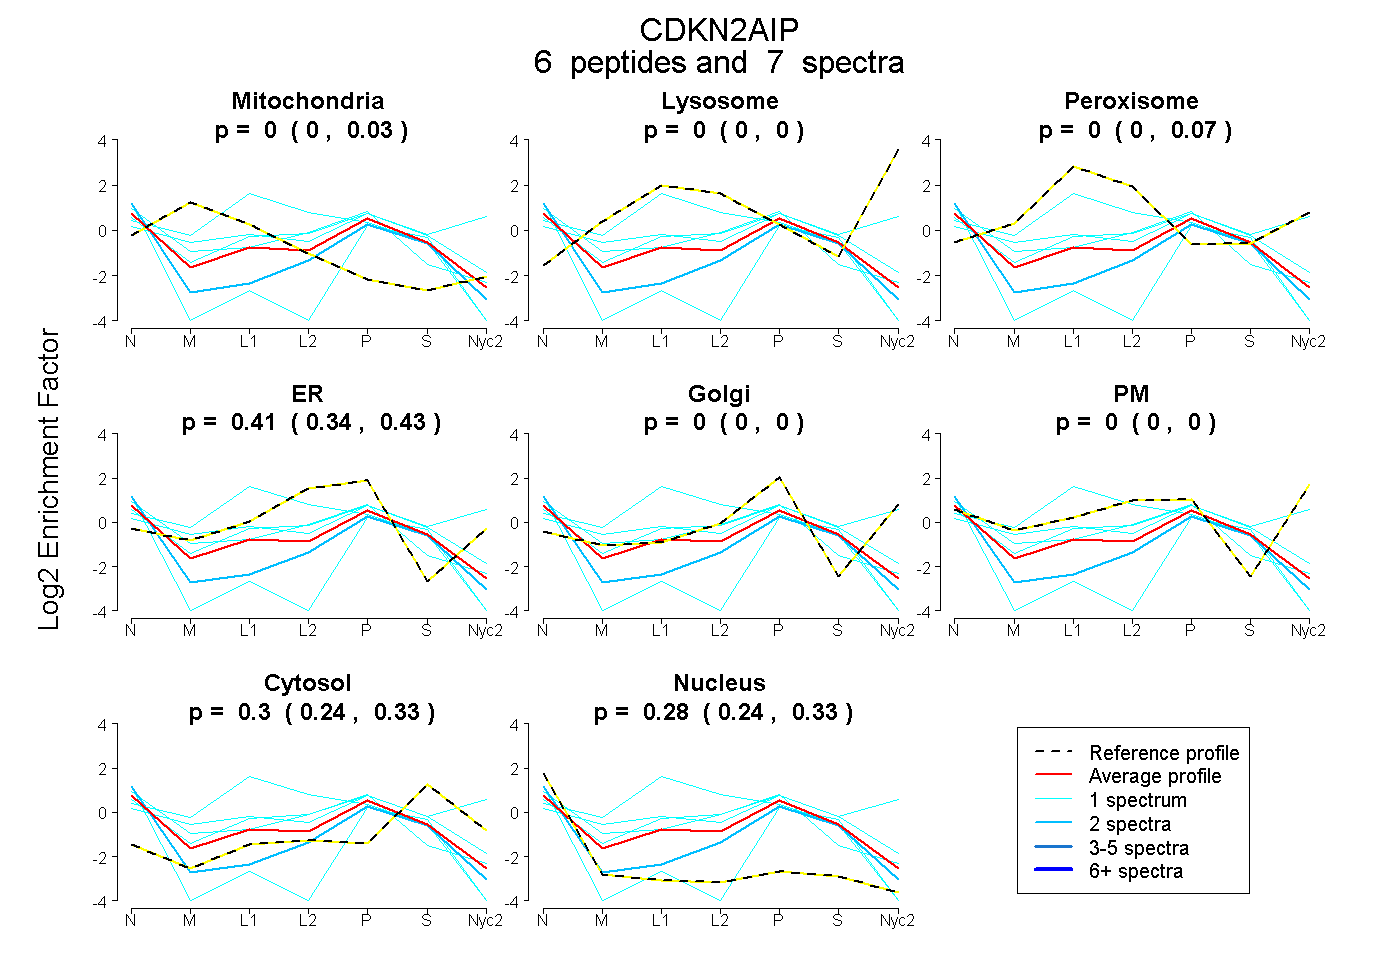
| Plot | Mito | Lyso | Perox | ER | Golgi | PM | Cytosol | Nucleus | |||||
| Expt A |
6 peptides |
7 spectra |
|
0.000 0.000 | 0.030 |
0.000 0.000 | 0.000 |
0.000 0.000 | 0.074 |
0.413 0.344 | 0.435 |
0.000 0.000 | 0.000 |
0.000 0.000 | 0.000 |
0.304 0.241 | 0.334 |
0.283 0.241 | 0.326 |