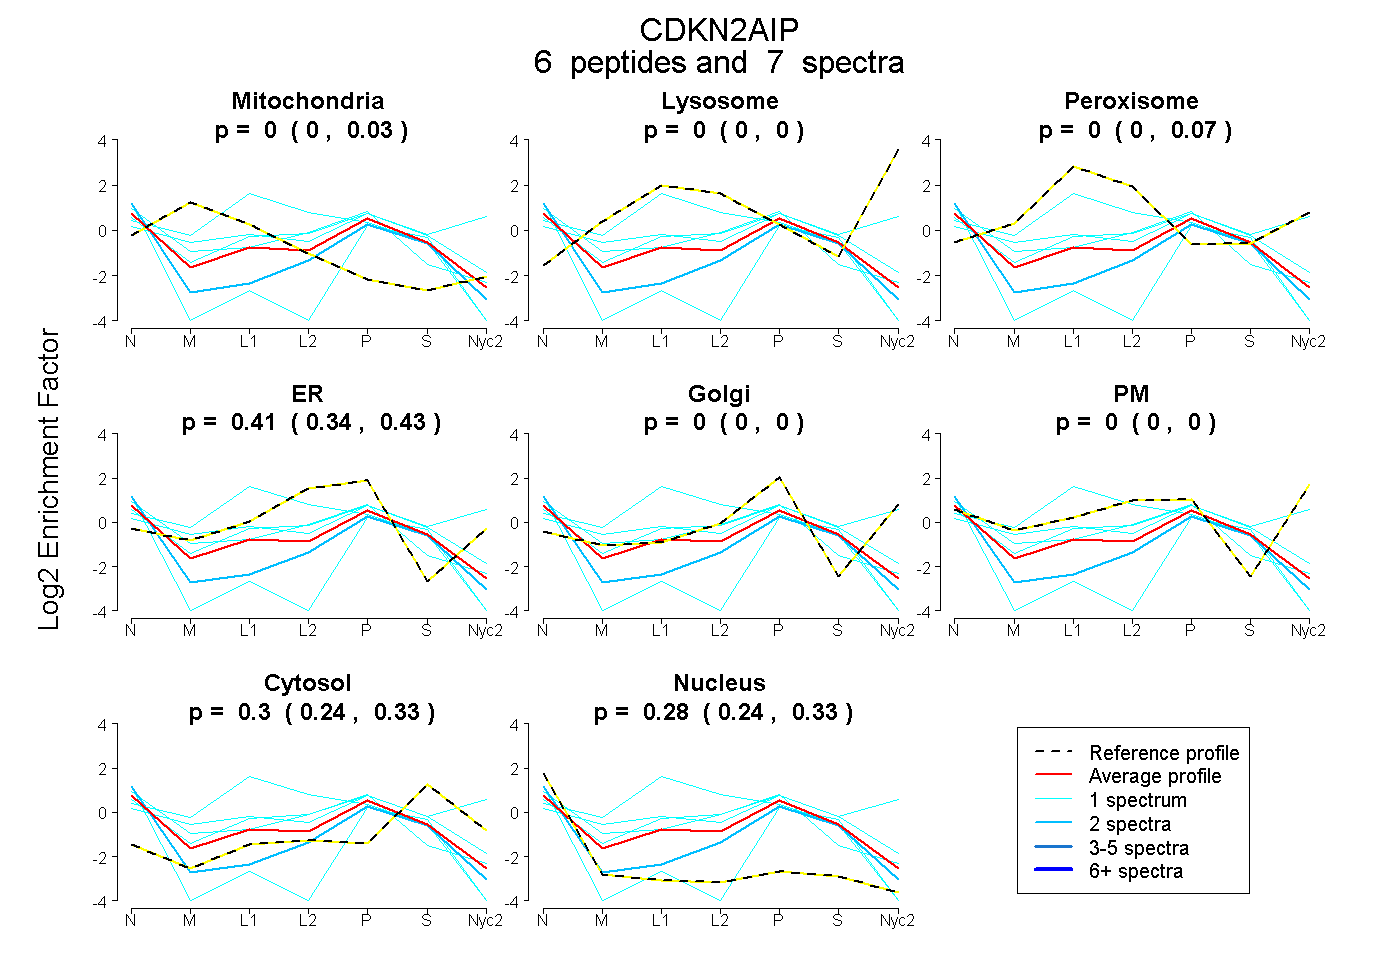
 6
6peptides
spectra
0.000 | 0.030
0.000 | 0.000
0.000 | 0.074
0.344 | 0.435
0.000 | 0.000
0.000 | 0.000
0.241 | 0.334
0.241 | 0.326
| Plot | Mito | Lyso | Perox | ER | Golgi | PM | Cytosol | Nucleus | |||||
| Expt A |
6 peptides |
7 spectra |
|
0.000 0.000 | 0.030 |
0.000 0.000 | 0.000 |
0.000 0.000 | 0.074 |
0.413 0.344 | 0.435 |
0.000 0.000 | 0.000 |
0.000 0.000 | 0.000 |
0.304 0.241 | 0.334 |
0.283 0.241 | 0.326 |
| 1 spectrum, SSQESIVCELR | 0.000 | 0.000 | 0.085 | 0.435 | 0.000 | 0.000 | 0.331 | 0.150 | ||
| 1 spectrum, STSLGSMSQLASK | 0.000 | 0.000 | 0.107 | 0.000 | 0.184 | 0.360 | 0.350 | 0.000 | ||
| 2 spectra, VAAWVETLR | 0.000 | 0.000 | 0.000 | 0.236 | 0.000 | 0.000 | 0.293 | 0.471 | ||
| 1 spectrum, QPFFNR | 0.040 | 0.000 | 0.011 | 0.586 | 0.000 | 0.000 | 0.074 | 0.289 | ||
| 1 spectrum, GISSSNEGVEEPSK | 0.000 | 0.000 | 0.000 | 0.000 | 0.000 | 0.000 | 0.323 | 0.677 | ||
| 1 spectrum, ATLDVFFVPLK | 0.232 | 0.000 | 0.360 | 0.231 | 0.000 | 0.000 | 0.000 | 0.177 |