 7
7peptides
spectra

0.000 | 0.000
0.000 | 0.000
0.000 | 0.000
0.000 | 0.000
0.000 | 0.000
0.243 | 0.265
0.618 | 0.638
0.108 | 0.122
5peptides
spectra

0.000 | 0.000
1.000 | 1.000
1peptide
spectrum
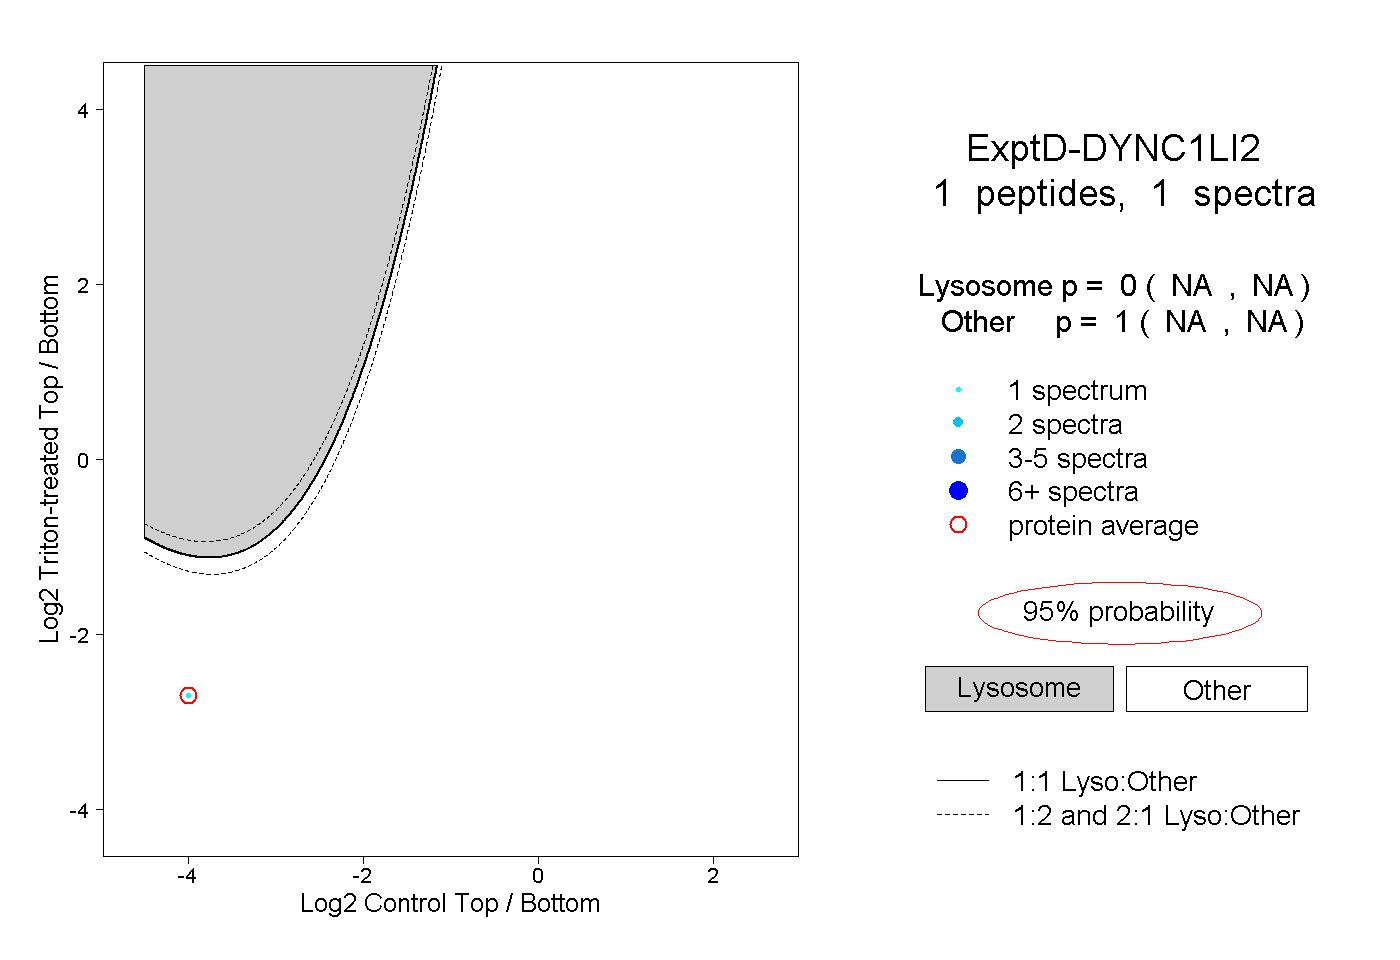
NA | NA
NA | NA