 7
7peptides
spectra

0.000 | 0.000
0.000 | 0.000
0.000 | 0.000
0.000 | 0.000
0.000 | 0.000
0.243 | 0.265
0.618 | 0.638
0.108 | 0.122
| Plot | Mito | Lyso | Perox | ER | Golgi | PM | Cytosol | Nucleus | |||||
| Expt A |
7 peptides |
15 spectra |
|
0.000 0.000 | 0.000 |
0.000 0.000 | 0.000 |
0.000 0.000 | 0.000 |
0.000 0.000 | 0.000 |
0.000 0.000 | 0.000 |
0.255 0.243 | 0.265 |
0.629 0.618 | 0.638 |
0.116 0.108 | 0.122 |
| 2 spectra, NLDLLYK | 0.000 | 0.000 | 0.000 | 0.000 | 0.000 | 0.252 | 0.592 | 0.156 | ||
| 4 spectra, WASVLR | 0.000 | 0.000 | 0.000 | 0.000 | 0.000 | 0.373 | 0.506 | 0.120 | ||
| 2 spectra, FAVSAESLR | 0.000 | 0.000 | 0.000 | 0.000 | 0.000 | 0.246 | 0.633 | 0.122 | ||
| 2 spectra, GGPASVPSASPGTSVK | 0.000 | 0.000 | 0.000 | 0.064 | 0.000 | 0.151 | 0.719 | 0.066 | ||
| 1 spectrum, NILVFGEDGSGK | 0.000 | 0.000 | 0.000 | 0.000 | 0.103 | 0.187 | 0.594 | 0.116 | ||
| 2 spectra, DAVFIPAGWDNEK | 0.000 | 0.000 | 0.000 | 0.000 | 0.000 | 0.208 | 0.685 | 0.107 | ||
| 2 spectra, ELAAEDEQVFLMK | 0.000 | 0.000 | 0.000 | 0.063 | 0.000 | 0.150 | 0.670 | 0.117 |
| Plot | Lyso | Other | |||||||||||
| Expt C |
5 peptides |
6 spectra |
 |
0.000 0.000 | 0.000 |
1.000 1.000 | 1.000 |
||||||||
| Plot | Lyso | Other | |||||||||||
| Expt D |
1 peptide |
1 spectrum |
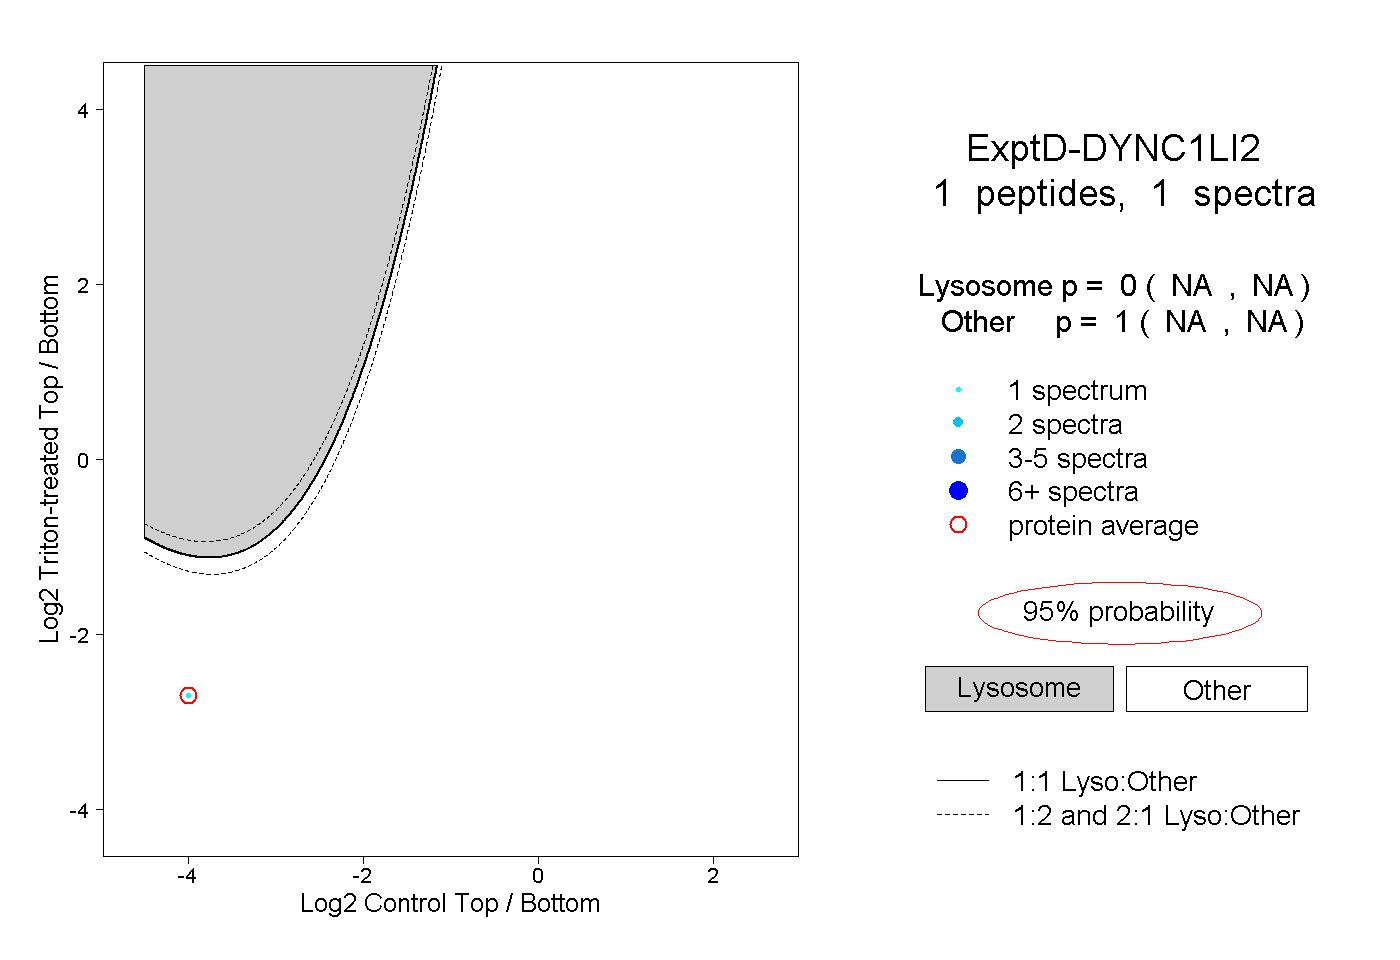 |
0.000 NA | NA |
1.000 NA | NA |