 8
8peptides
spectra
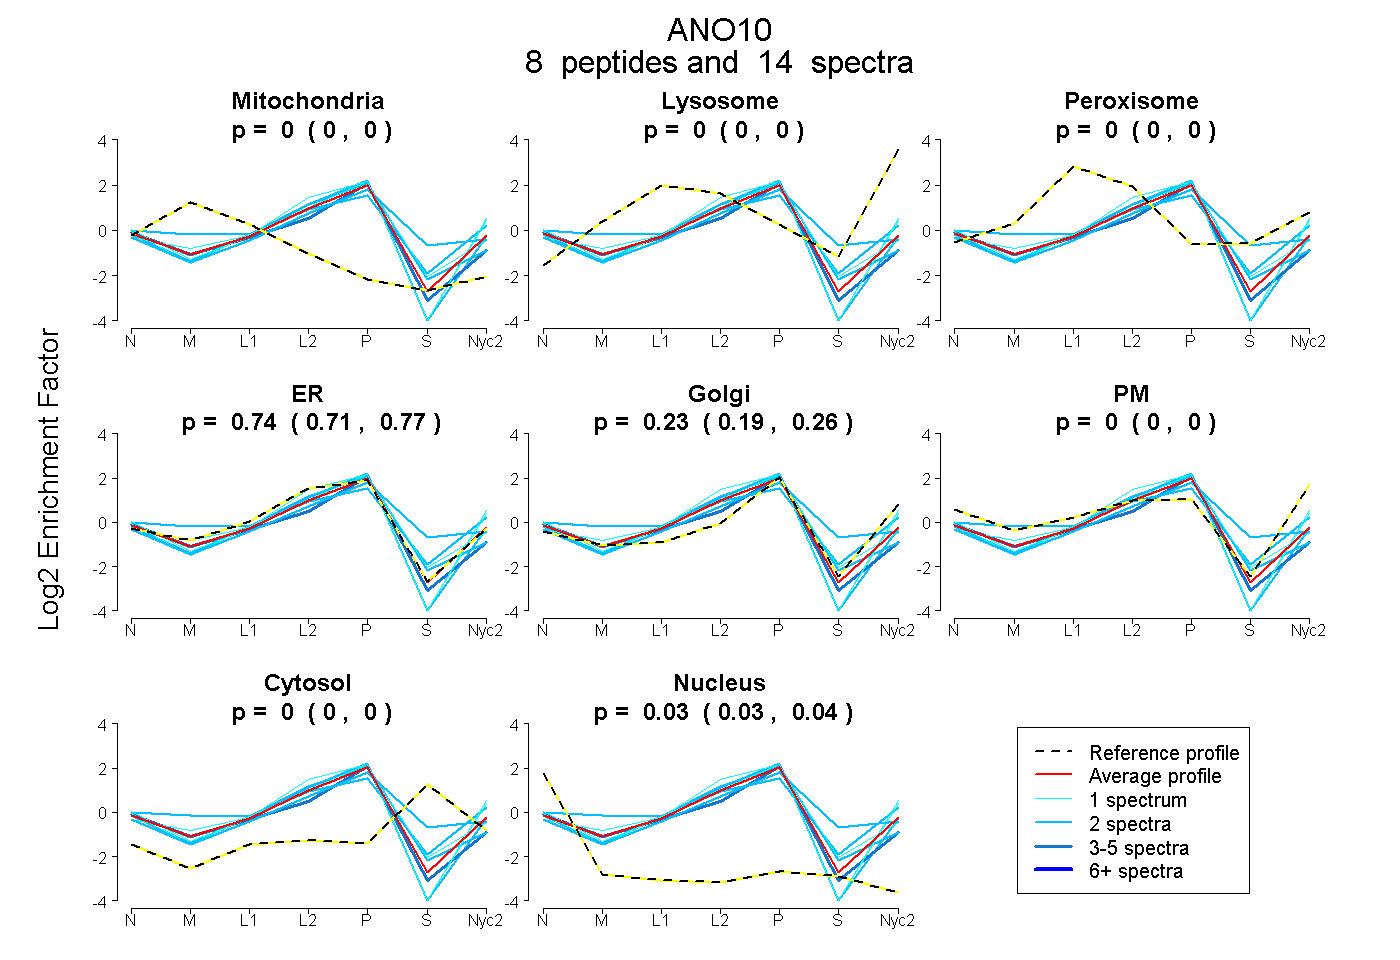
0.000 | 0.000
0.000 | 0.000
0.000 | 0.000
0.708 | 0.767
0.185 | 0.259
0.000 | 0.000
0.000 | 0.000
0.025 | 0.042
2peptides
spectra
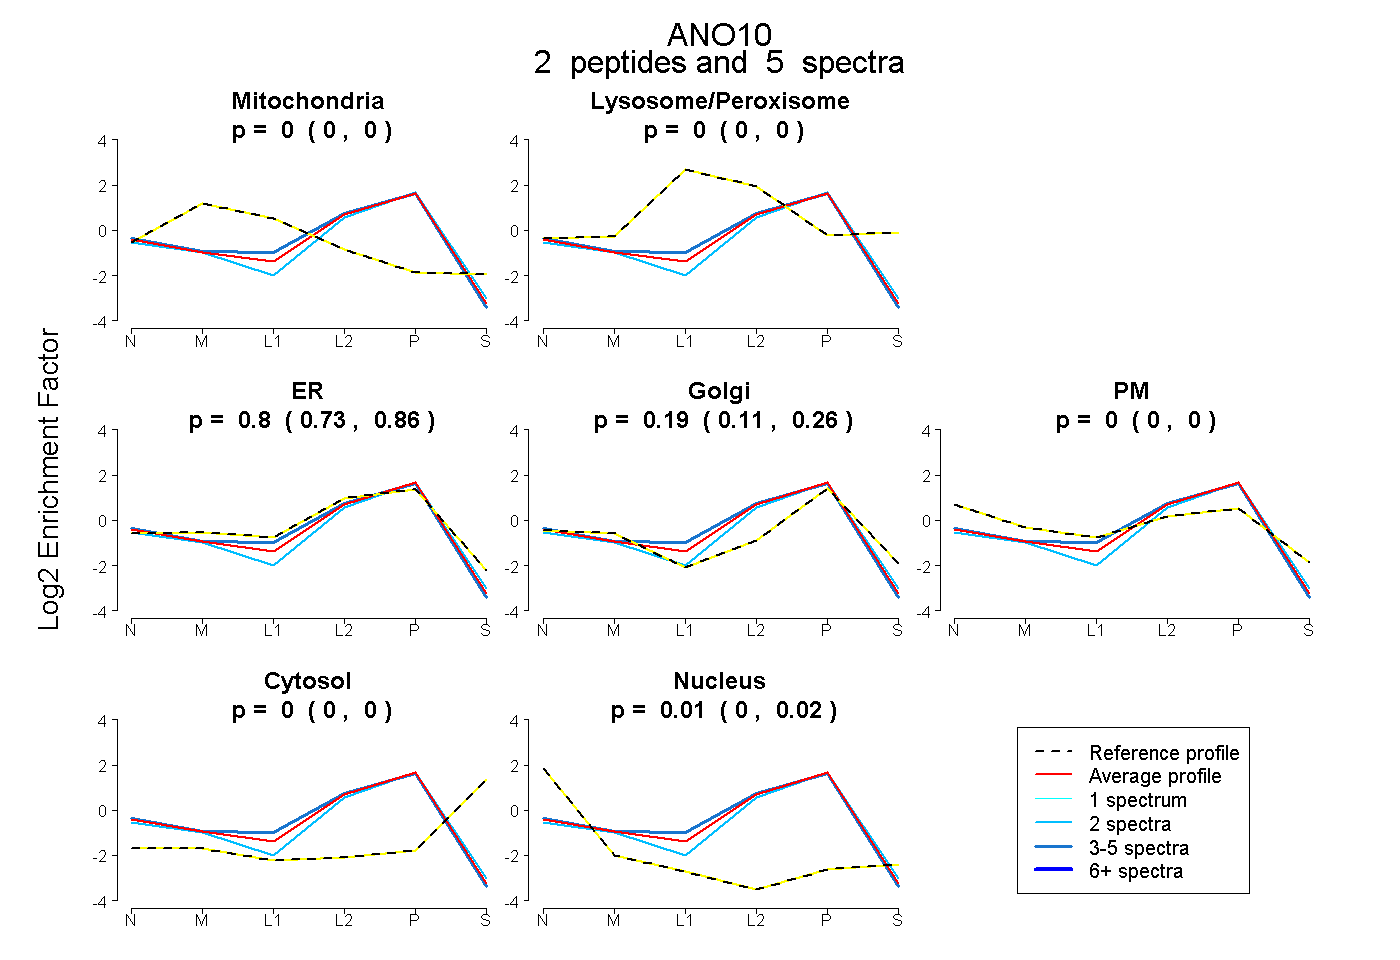
0.000 | 0.000
0.000 | 0.000
0.728 | 0.855
0.112 | 0.258
0.000 | 0.000
0.000 | 0.000
0.000 | 0.018
7peptides
spectra
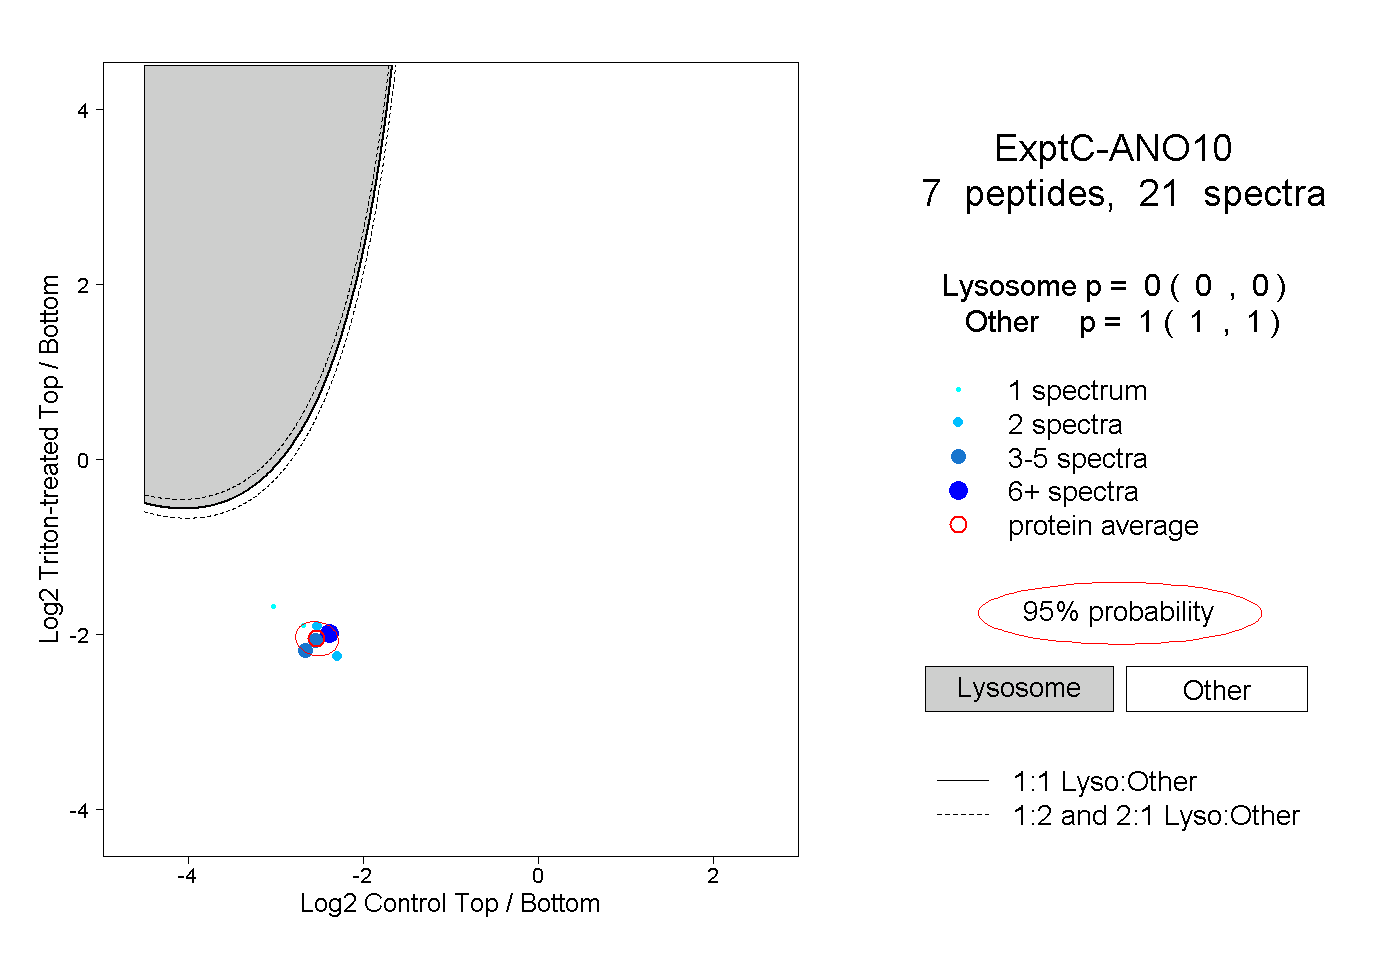
0.000 | 0.000
1.000 | 1.000
1peptide
spectra
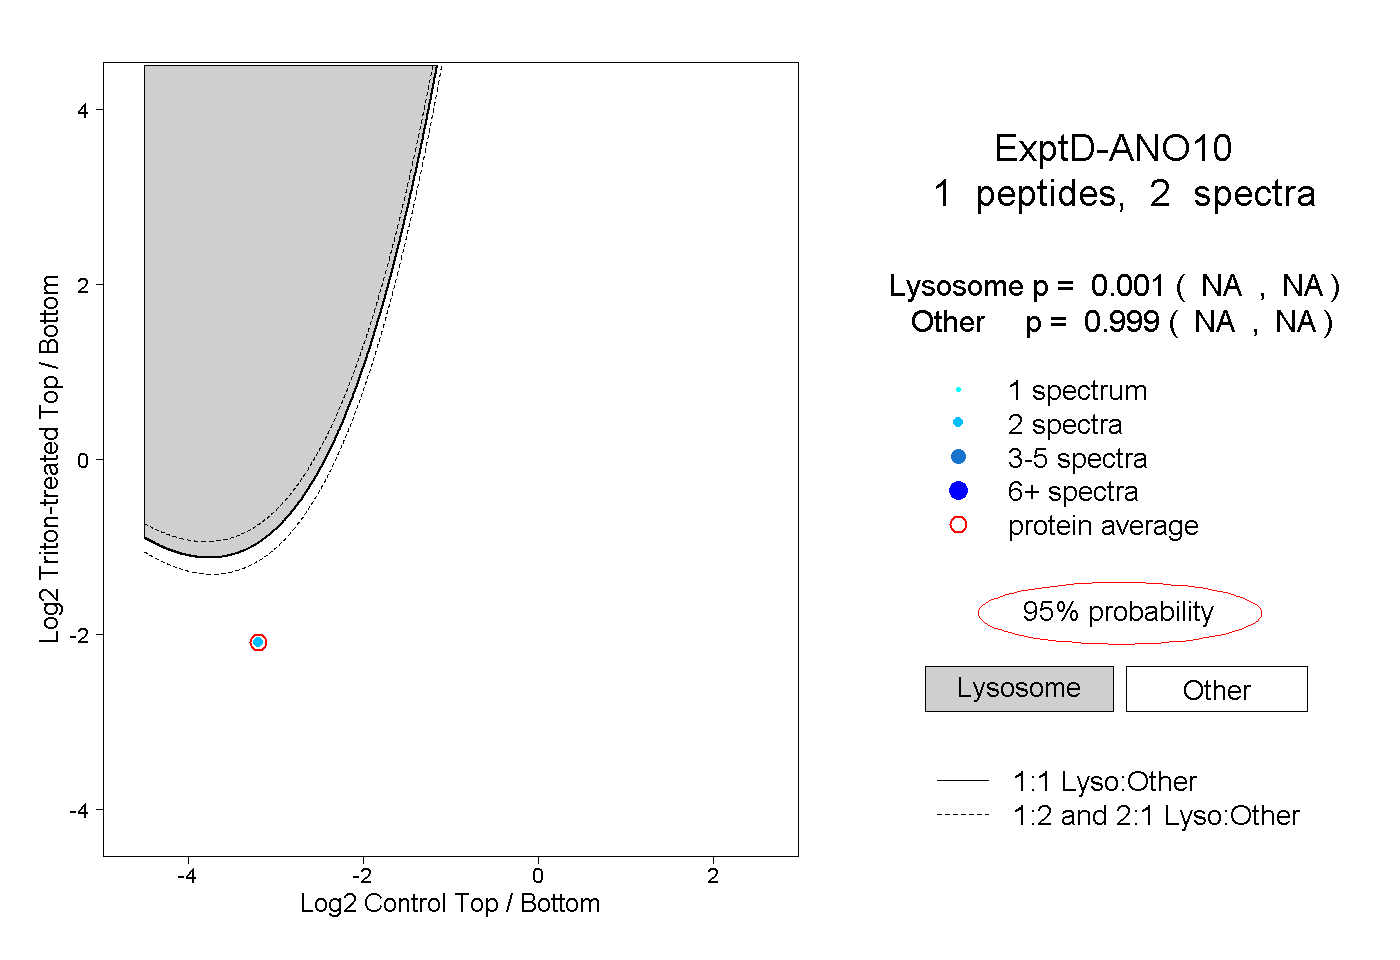
NA | NA
NA | NA