 8
8peptides
spectra
0.000 | 0.000
0.000 | 0.000
0.000 | 0.000
0.708 | 0.767
0.185 | 0.259
0.000 | 0.000
0.000 | 0.000
0.025 | 0.042
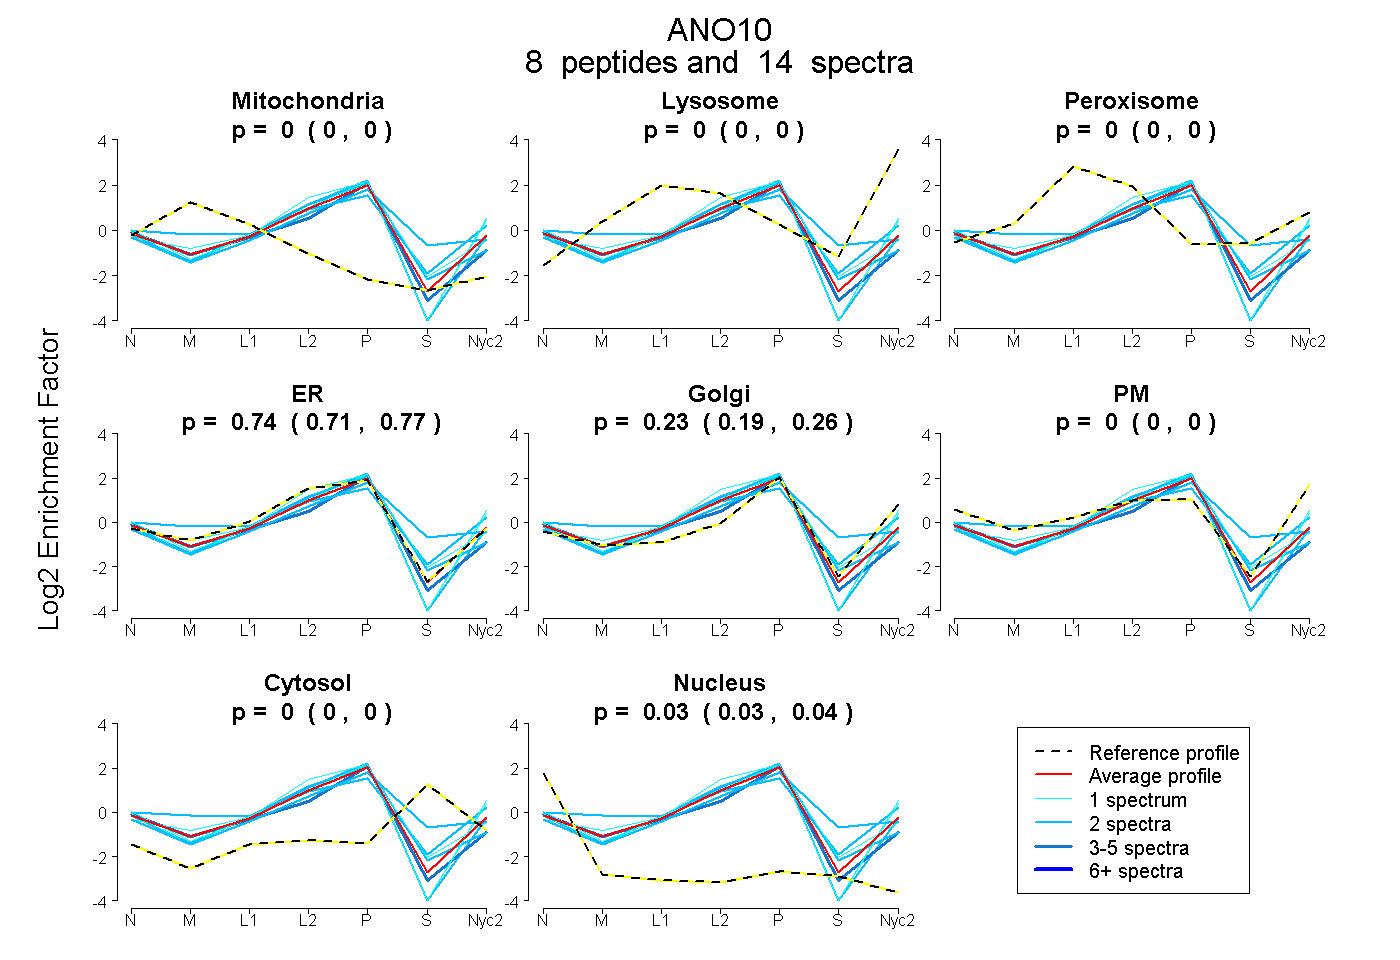
| Plot | Mito | Lyso | Perox | ER | Golgi | PM | Cytosol | Nucleus | |||||
| Expt A |
8 peptides |
14 spectra |
|
0.000 0.000 | 0.000 |
0.000 0.000 | 0.000 |
0.000 0.000 | 0.000 |
0.740 0.708 | 0.767 |
0.226 0.185 | 0.259 |
0.000 0.000 | 0.000 |
0.000 0.000 | 0.000 |
0.035 0.025 | 0.042 |
| 1 spectrum, MIPGYPQAK | 0.000 | 0.000 | 0.000 | 0.582 | 0.335 | 0.083 | 0.000 | 0.000 | ||
| 1 spectrum, SDVDTTLYEQVLLEK | 0.000 | 0.000 | 0.000 | 0.782 | 0.113 | 0.000 | 0.090 | 0.015 | ||
| 2 spectra, ETLENQNLYLVGASNIR | 0.000 | 0.000 | 0.000 | 0.895 | 0.000 | 0.000 | 0.060 | 0.045 | ||
| 2 spectra, YQPIDSIR | 0.000 | 0.000 | 0.000 | 0.630 | 0.082 | 0.000 | 0.288 | 0.000 | ||
| 1 spectrum, WGTLVMK | 0.000 | 0.000 | 0.000 | 0.781 | 0.139 | 0.079 | 0.000 | 0.000 | ||
| 2 spectra, ECTDGAMR | 0.000 | 0.000 | 0.000 | 0.853 | 0.115 | 0.000 | 0.000 | 0.032 | ||
| 3 spectra, EEPVYSSYK | 0.000 | 0.000 | 0.000 | 0.761 | 0.136 | 0.000 | 0.000 | 0.103 | ||
| 2 spectra, LESAYQNHLVLK | 0.050 | 0.000 | 0.089 | 0.414 | 0.264 | 0.163 | 0.021 | 0.000 |
| Plot | Mito | Lyso or Perox | ER | Golgi | PM | Cytosol | Nucleus | ||||||
| Expt B |
2 peptides |
5 spectra |
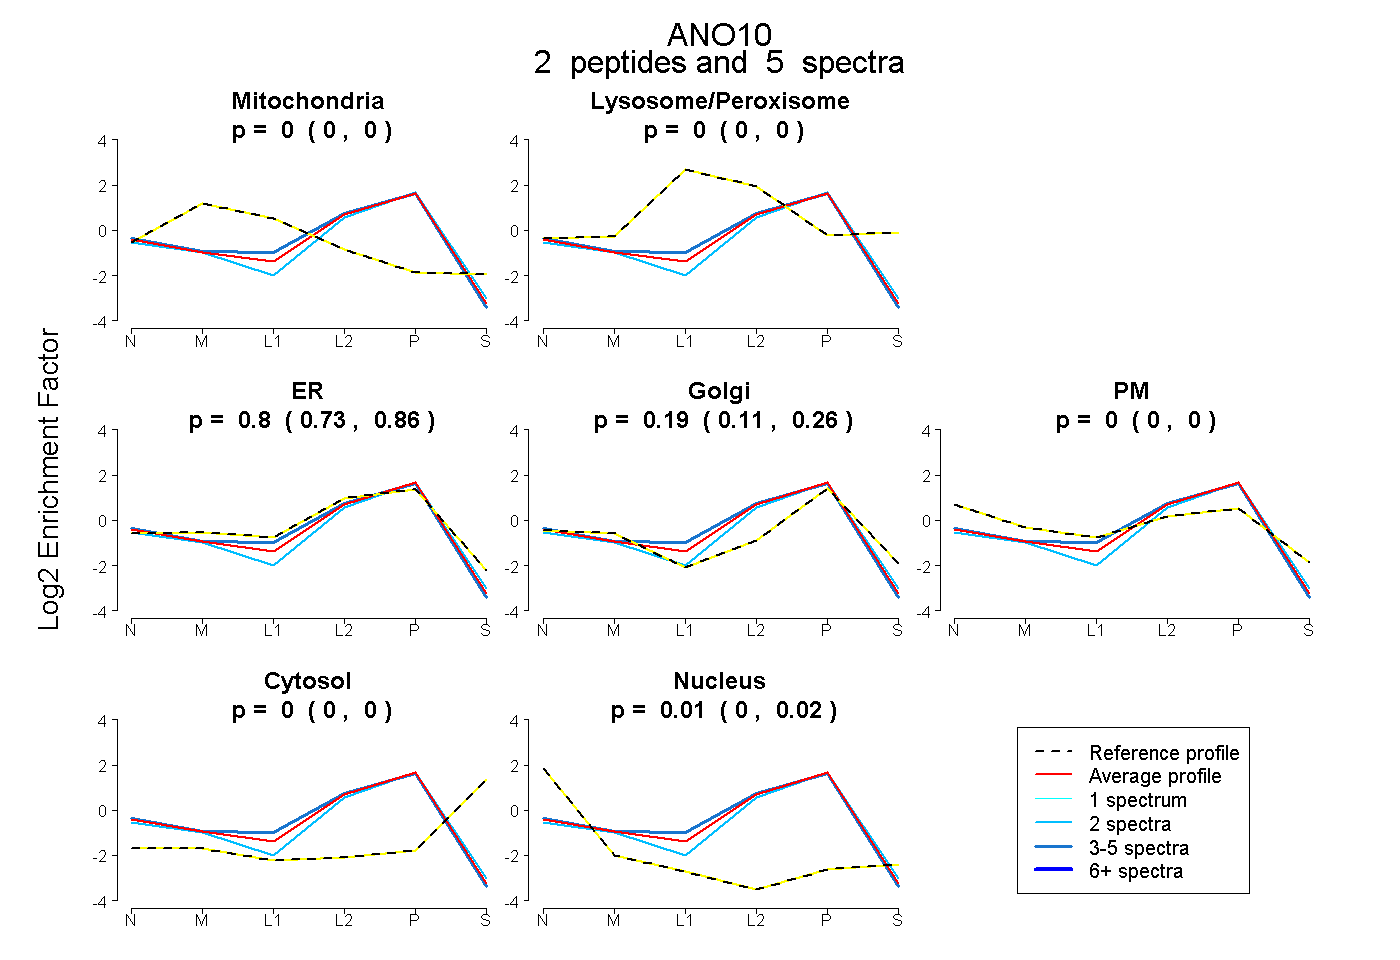 |
0.000 0.000 | 0.000 |
0.000 0.000 | 0.000 |
0.797 0.728 | 0.855 |
0.194 0.112 | 0.258 |
0.000 0.000 | 0.000 |
0.000 0.000 | 0.000 |
0.009 0.000 | 0.018 |
|||
| Plot | Lyso | Other | |||||||||||
| Expt C |
7 peptides |
21 spectra |
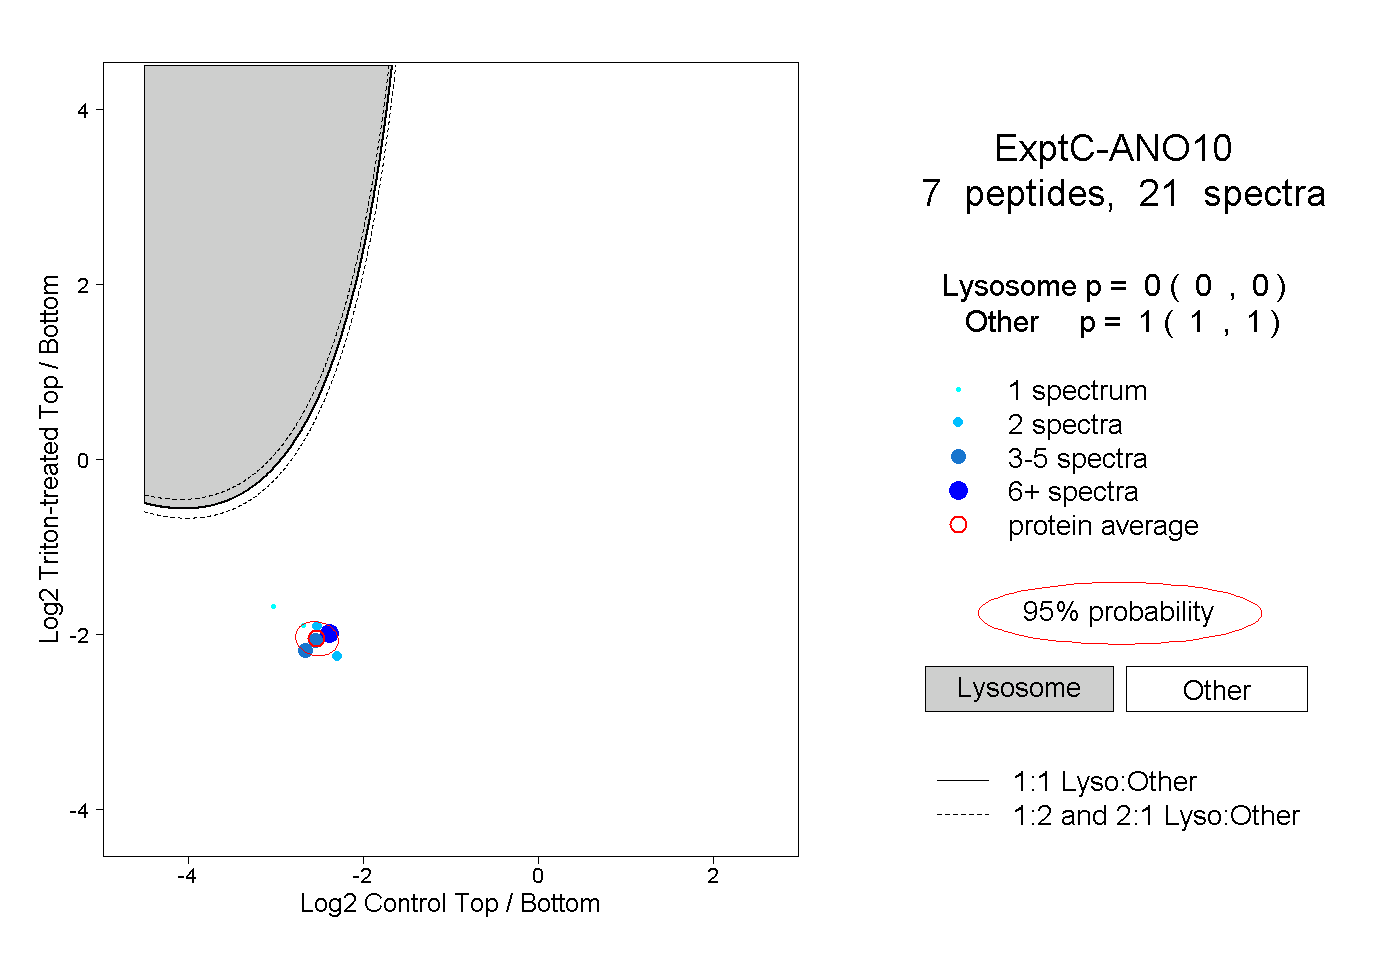 |
0.000 0.000 | 0.000 |
1.000 1.000 | 1.000 |
||||||||
| Plot | Lyso | Other | |||||||||||
| Expt D |
1 peptide |
2 spectra |
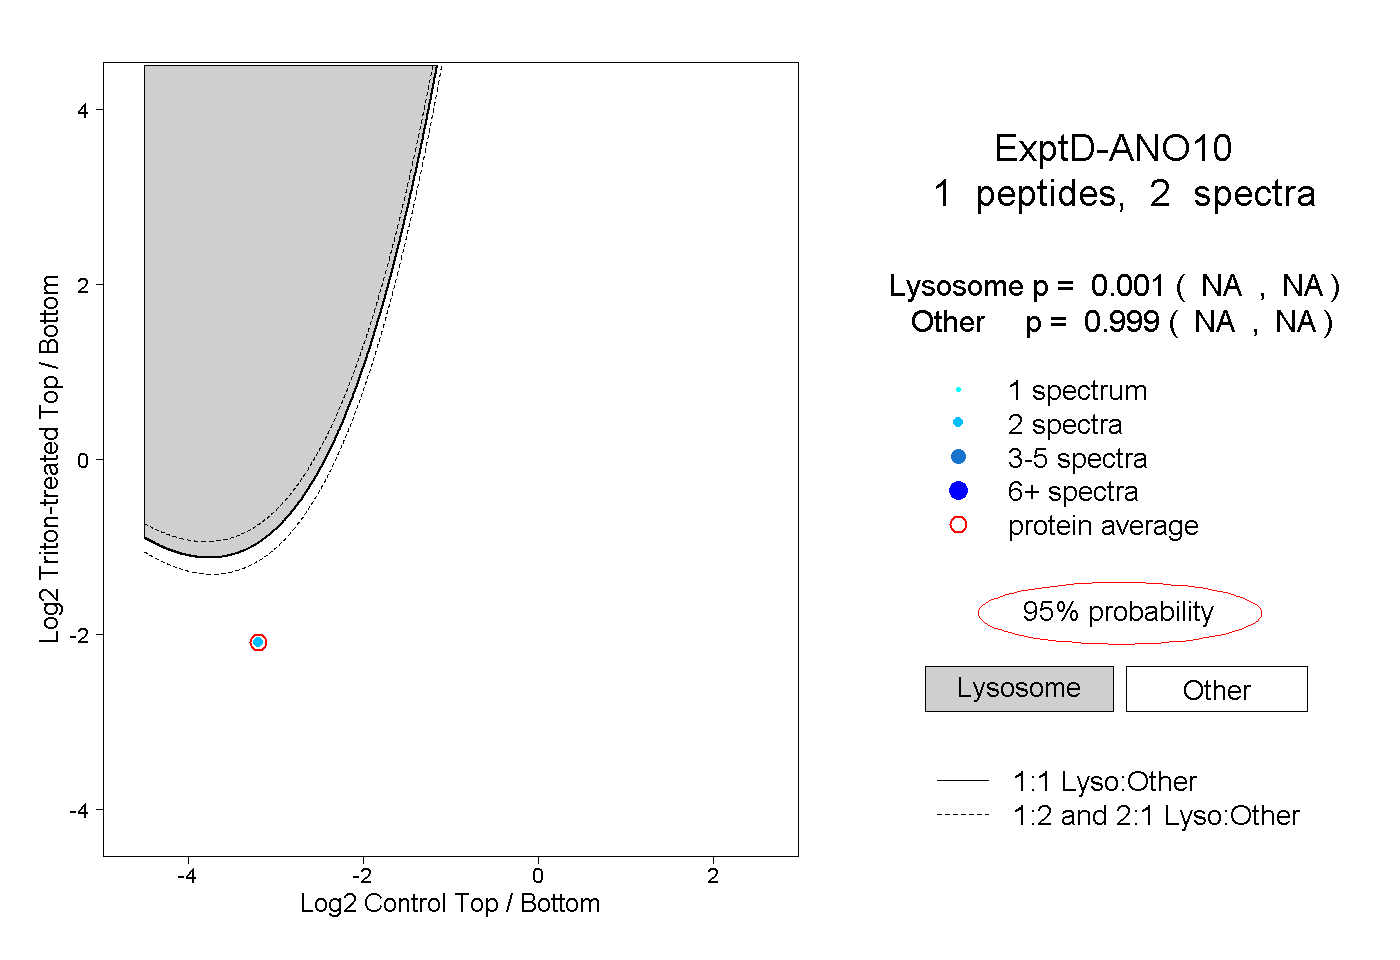 |
0.001 NA | NA |
0.999 NA | NA |