 42
42peptides
spectra
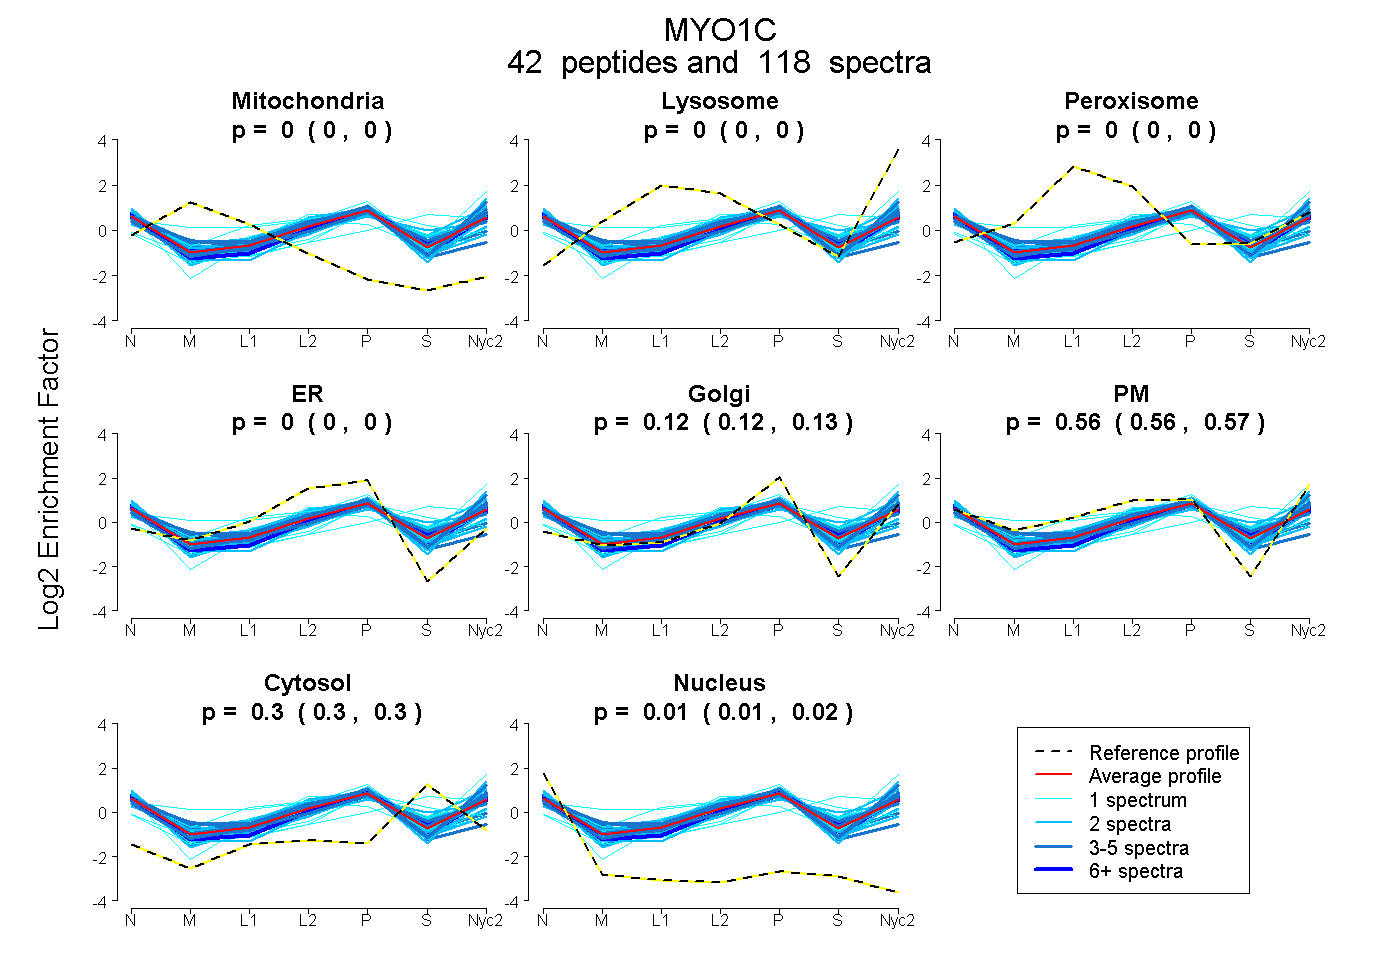
0.000 | 0.000
0.000 | 0.000
0.000 | 0.000
0.000 | 0.000
0.120 | 0.125
0.561 | 0.566
0.297 | 0.300
0.013 | 0.015
15peptides
spectra
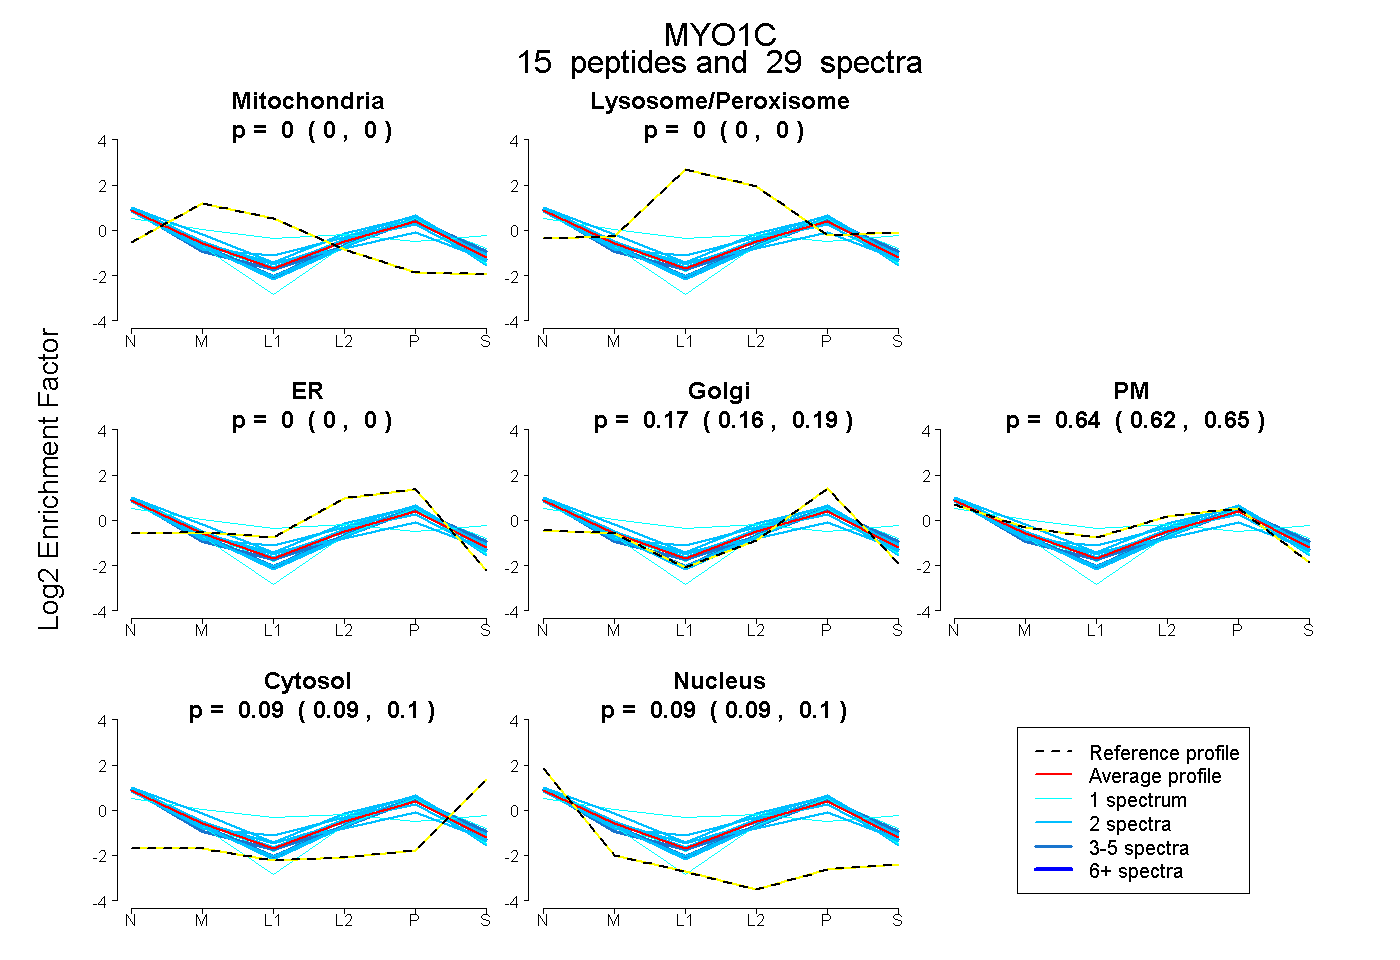
0.000 | 0.000
0.000 | 0.000
0.000 | 0.000
0.156 | 0.187
0.624 | 0.653
0.086 | 0.096
0.090 | 0.099
38peptides
spectra

0.000 | 0.000
1.000 | 1.000
2peptides
spectra

0.000 | 0.002
0.998 | 1.000