 5
5peptides
spectra
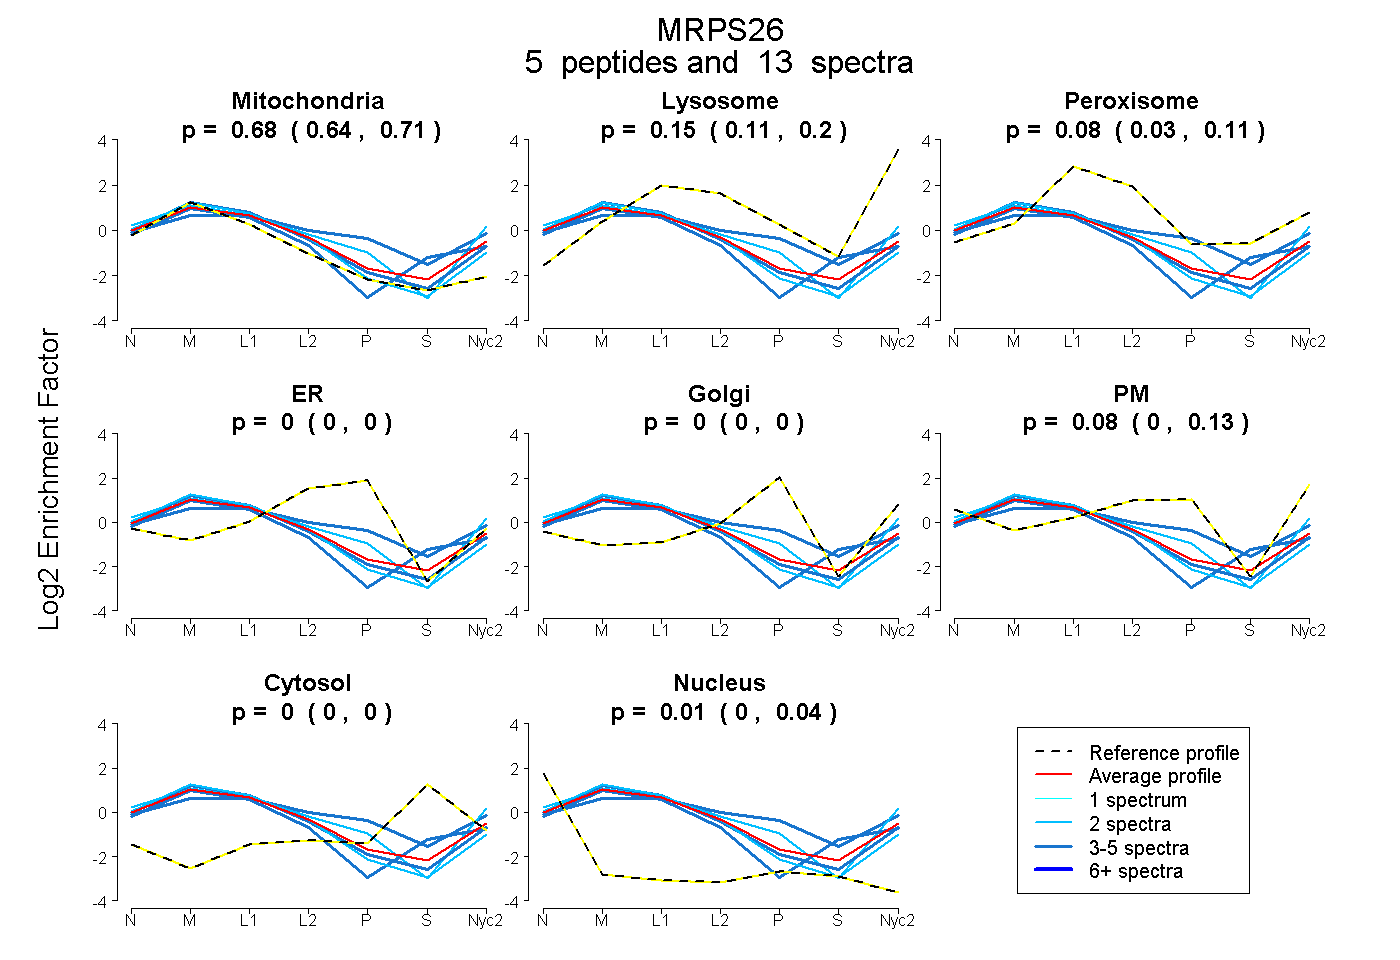
0.645 | 0.708
0.108 | 0.199
0.035 | 0.113
0.000 | 0.000
0.000 | 0.000
0.000 | 0.131
0.000 | 0.000
0.000 | 0.037
3peptides
spectra
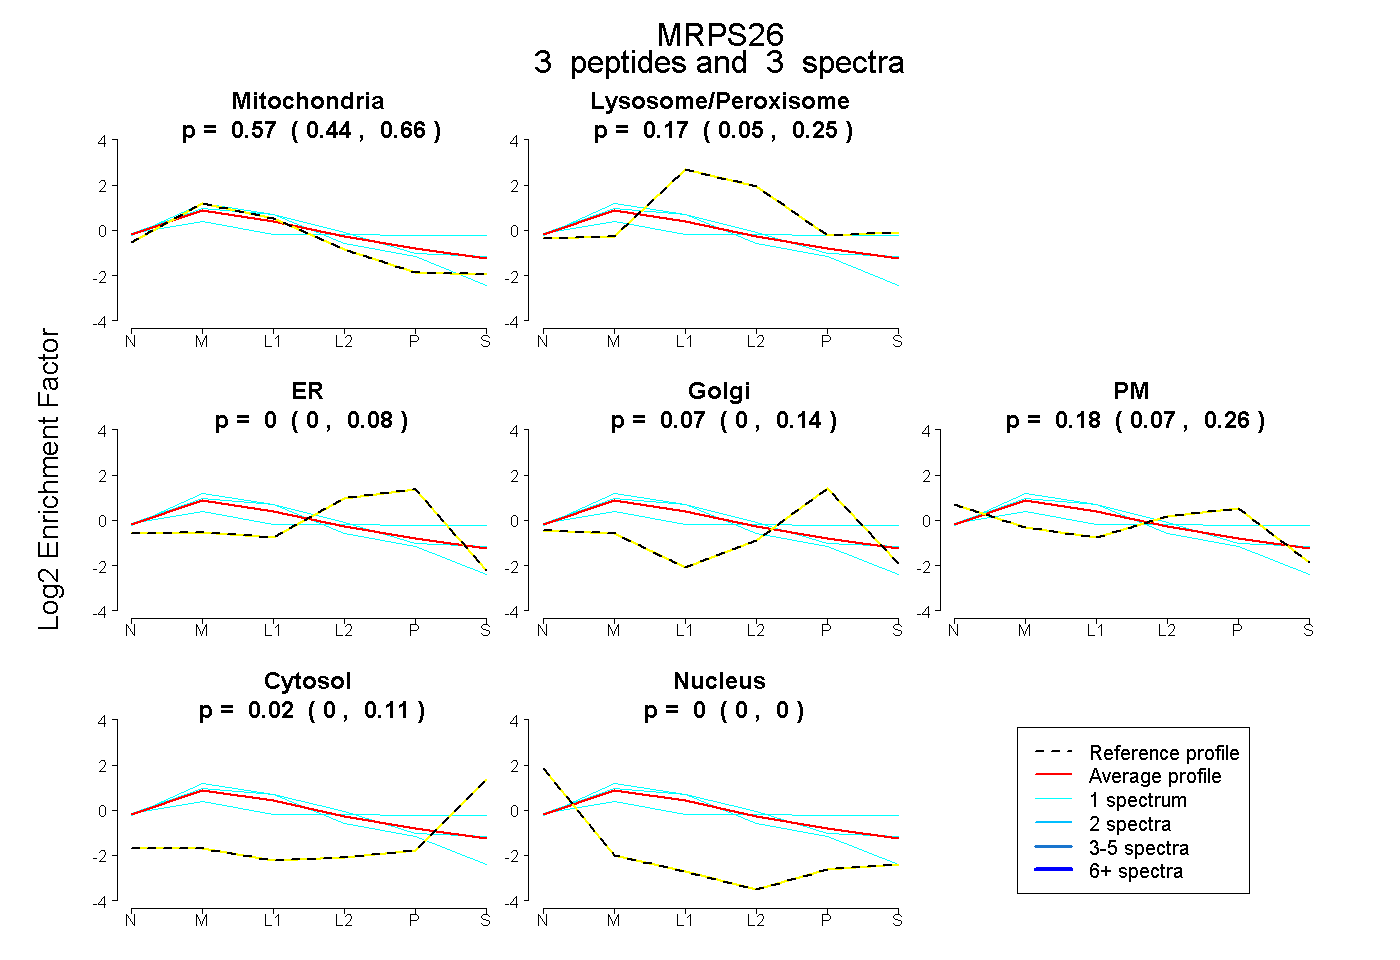
0.442 | 0.658
0.050 | 0.254
0.000 | 0.085
0.000 | 0.142
0.067 | 0.256
0.000 | 0.113
0.000 | 0.000
11peptides
spectra
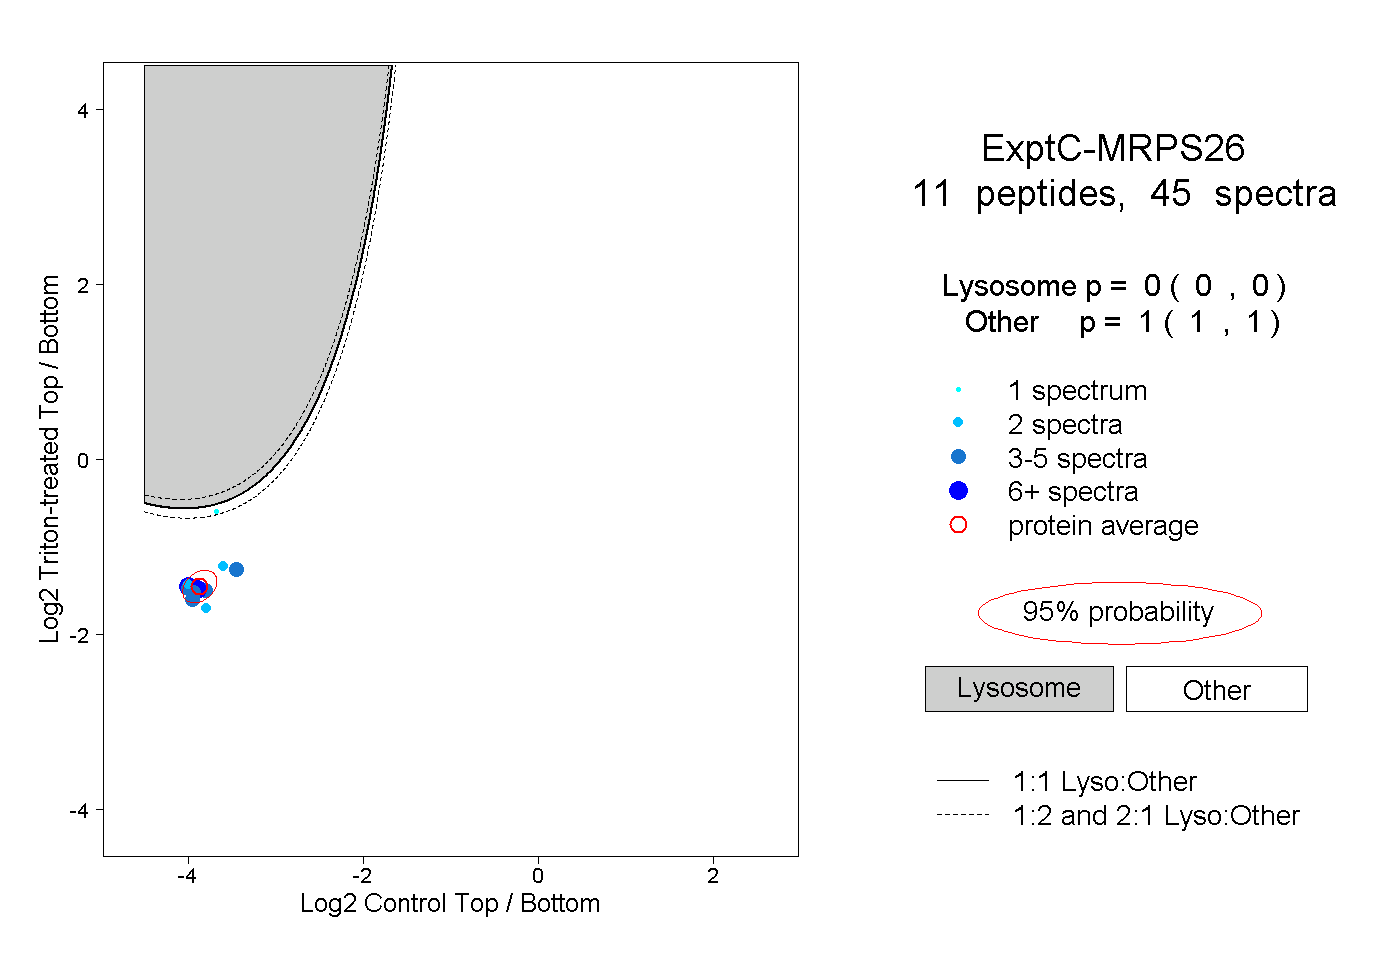
0.000 | 0.000
1.000 | 1.000
4peptides
spectra
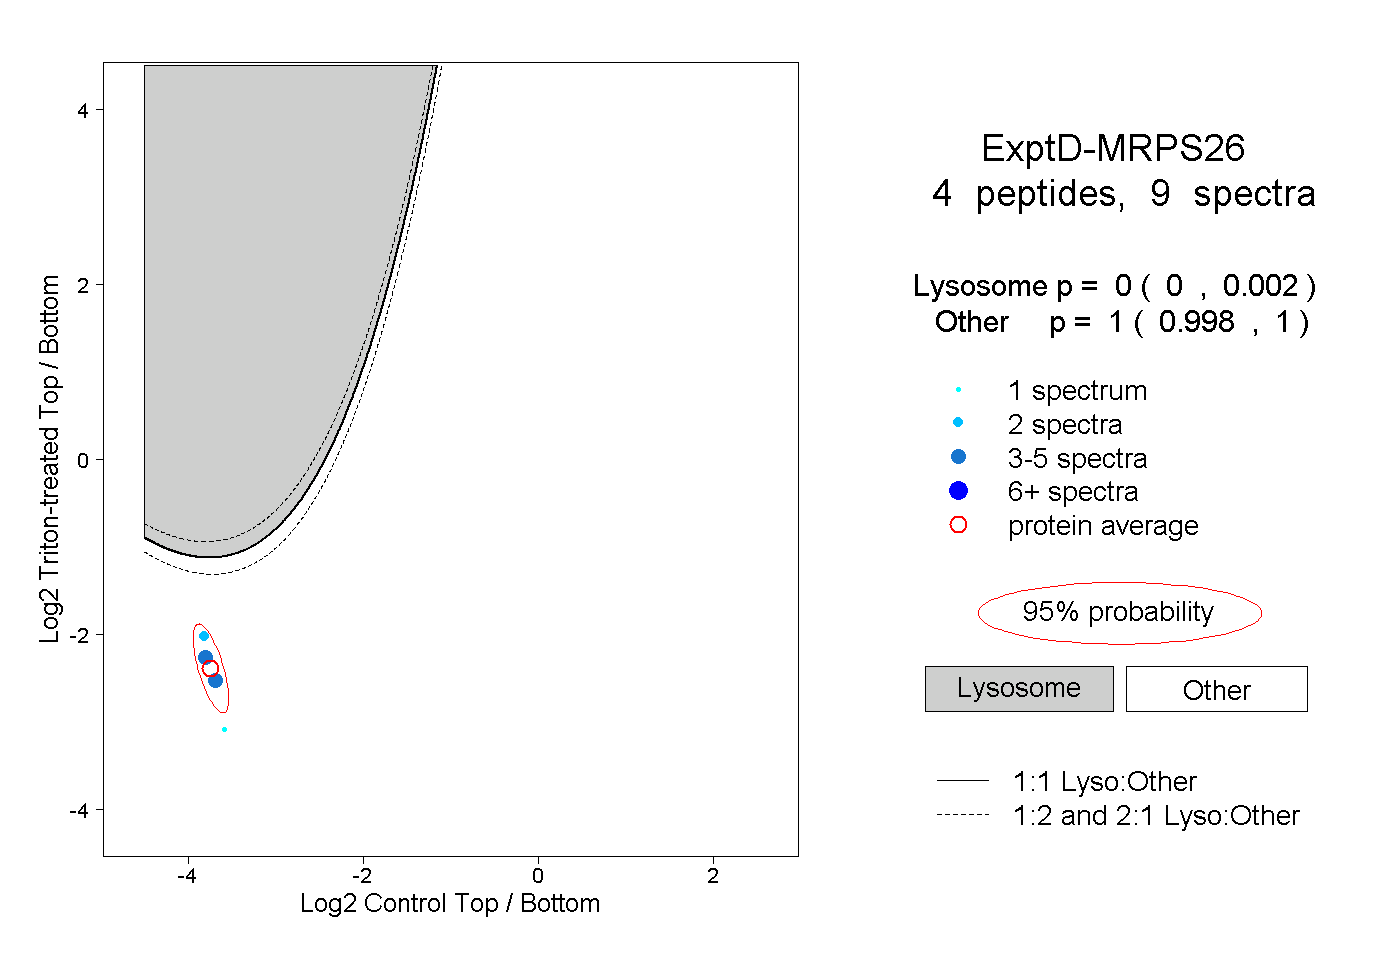
0.000 | 0.002
0.998 | 1.000