 5
5peptides
spectra
0.645 | 0.708
0.108 | 0.199
0.035 | 0.113
0.000 | 0.000
0.000 | 0.000
0.000 | 0.131
0.000 | 0.000
0.000 | 0.037
| Plot | Mito | Lyso | Perox | ER | Golgi | PM | Cytosol | Nucleus | |||||
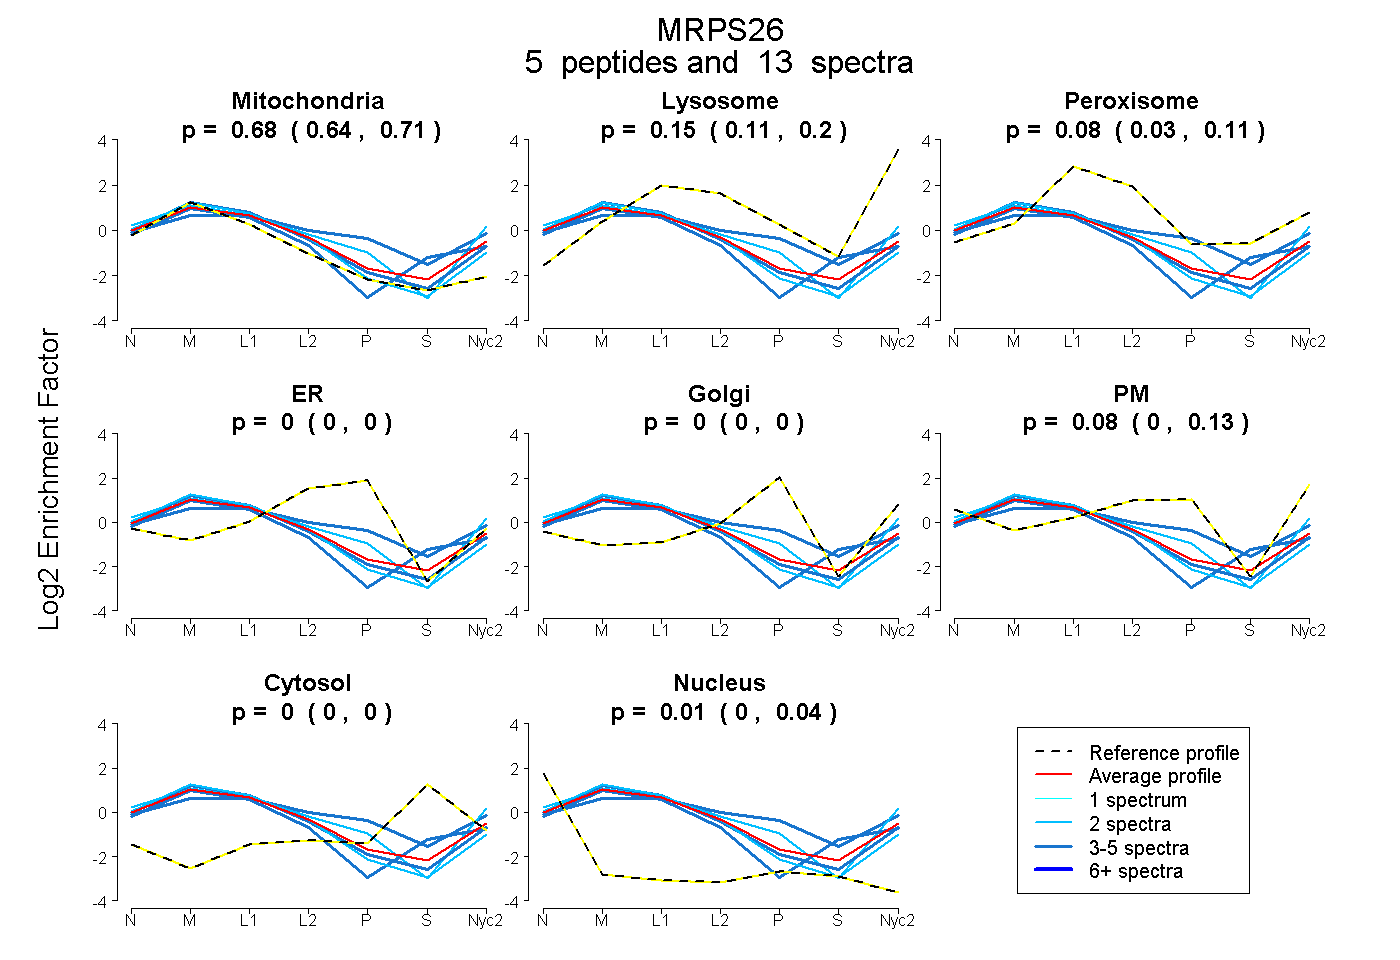
| Expt A |
5 peptides |
13 spectra |
|
0.681 0.645 | 0.708 |
0.153 0.108 | 0.199 |
0.078 0.035 | 0.113 |
0.000 0.000 | 0.000 |
0.000 0.000 | 0.000 |
0.076 0.000 | 0.131 |
0.000 0.000 | 0.000 |
0.012 0.000 | 0.037 |
| 2 spectra, QAEVQAQR | 0.817 | 0.089 | 0.044 | 0.000 | 0.000 | 0.050 | 0.000 | 0.000 | ||
| 2 spectra, EFTLEVR | 0.558 | 0.109 | 0.000 | 0.000 | 0.000 | 0.333 | 0.000 | 0.000 | ||
| 3 spectra, AQEEQAWVQLK | 0.391 | 0.018 | 0.249 | 0.000 | 0.148 | 0.153 | 0.041 | 0.000 | ||
| 3 spectra, IEEALDSPK | 0.677 | 0.014 | 0.180 | 0.000 | 0.000 | 0.000 | 0.129 | 0.000 | ||
| 3 spectra, LQLEAQAQELR | 0.772 | 0.150 | 0.031 | 0.000 | 0.000 | 0.047 | 0.000 | 0.000 |
| Plot | Mito | Lyso or Perox | ER | Golgi | PM | Cytosol | Nucleus | ||||||
| Expt B |
3 peptides |
3 spectra |
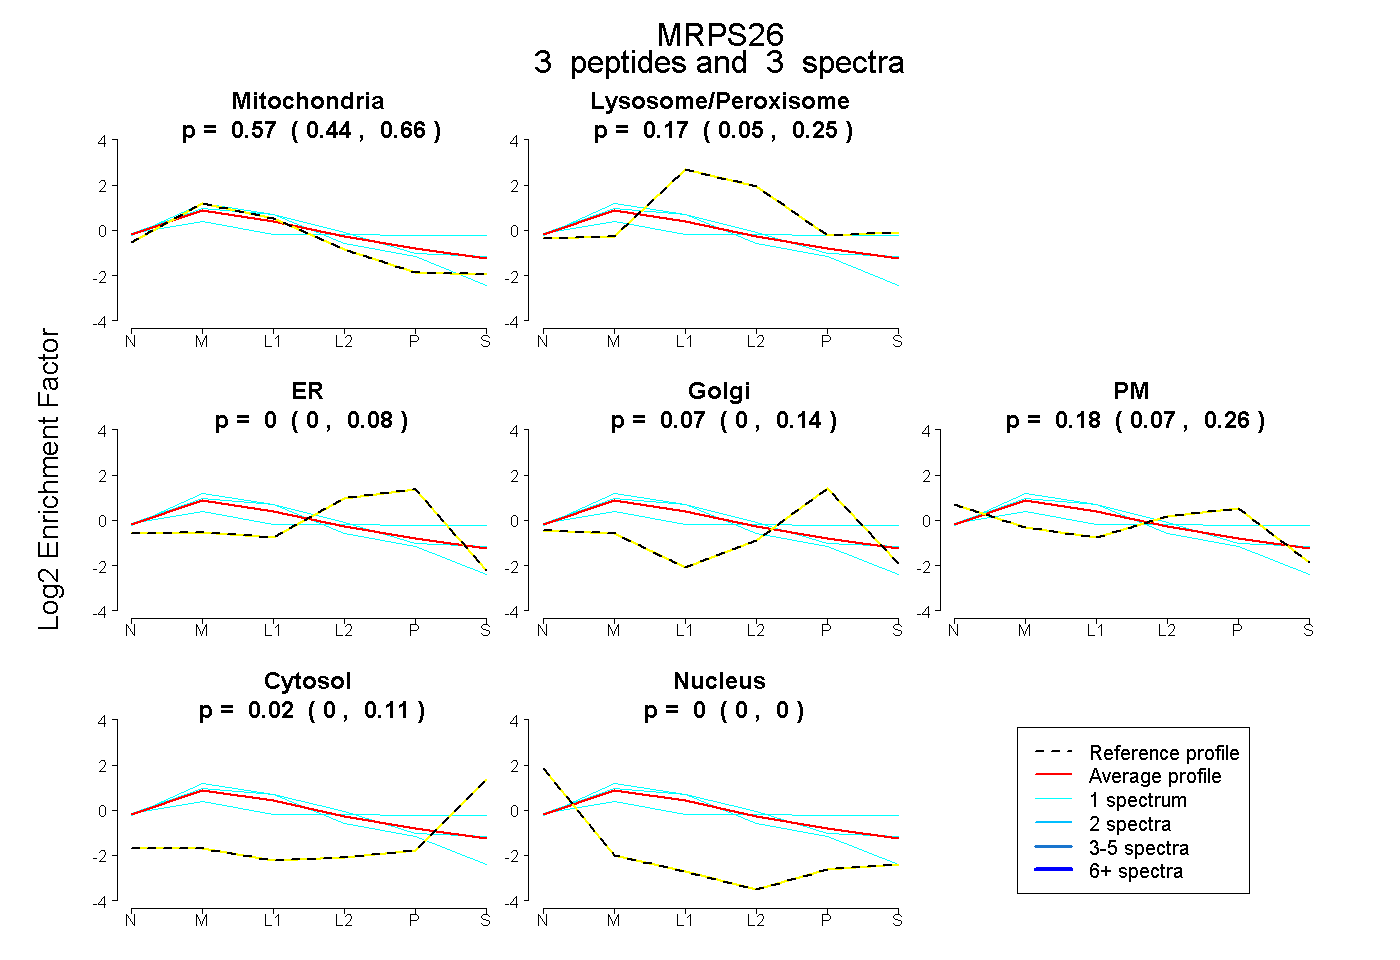 |
0.568 0.442 | 0.658 |
0.172 0.050 | 0.254 |
0.000 0.000 | 0.085 |
0.065 0.000 | 0.142 |
0.176 0.067 | 0.256 |
0.019 0.000 | 0.113 |
0.000 0.000 | 0.000 |
|||
| Plot | Lyso | Other | |||||||||||
| Expt C |
11 peptides |
45 spectra |
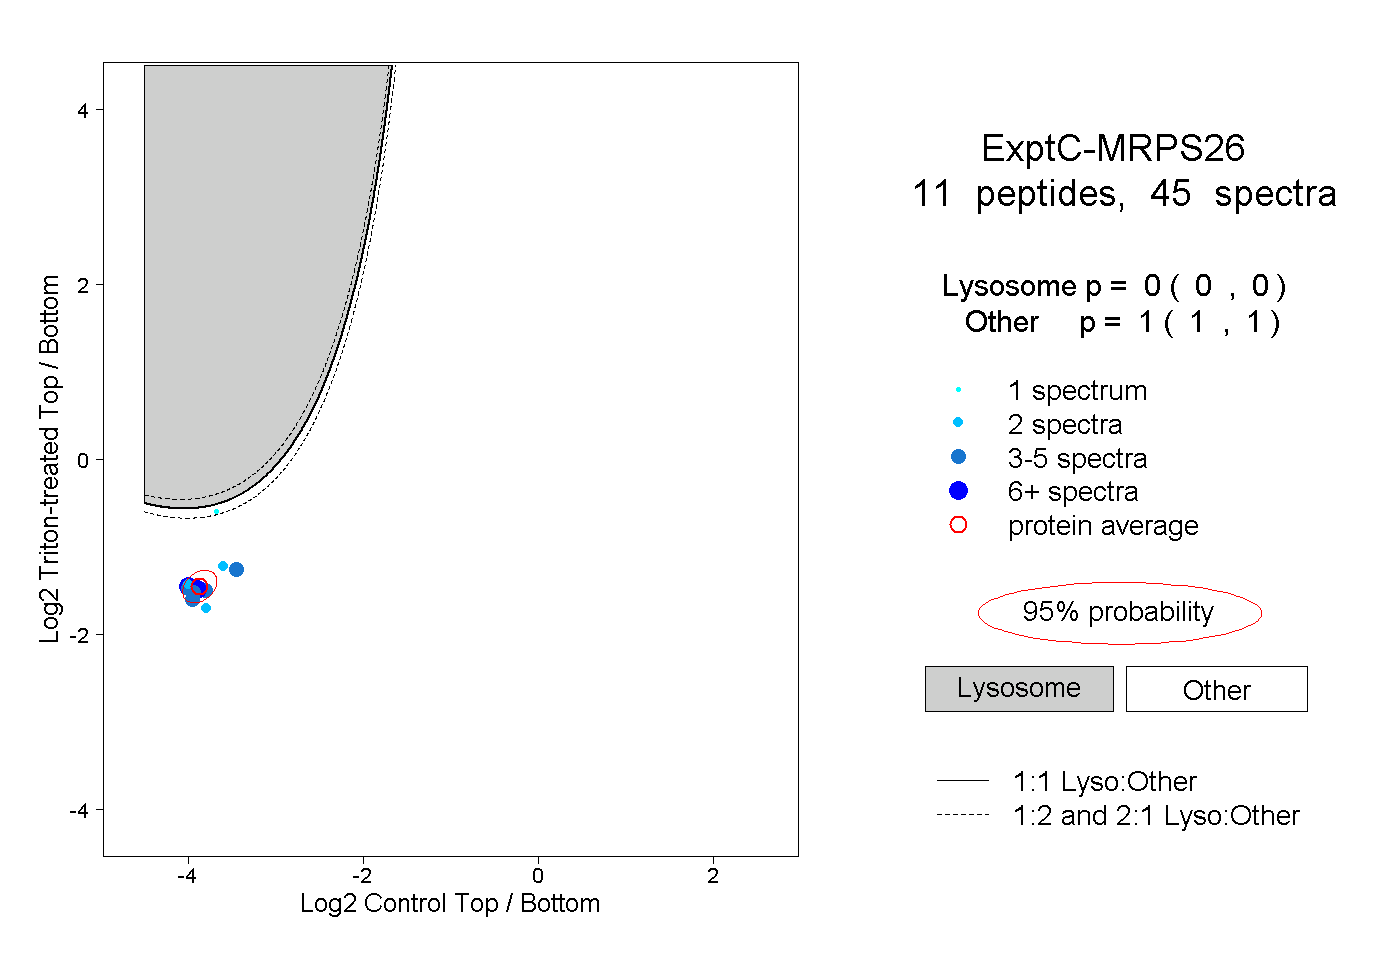 |
0.000 0.000 | 0.000 |
1.000 1.000 | 1.000 |
||||||||
| Plot | Lyso | Other | |||||||||||
| Expt D |
4 peptides |
9 spectra |
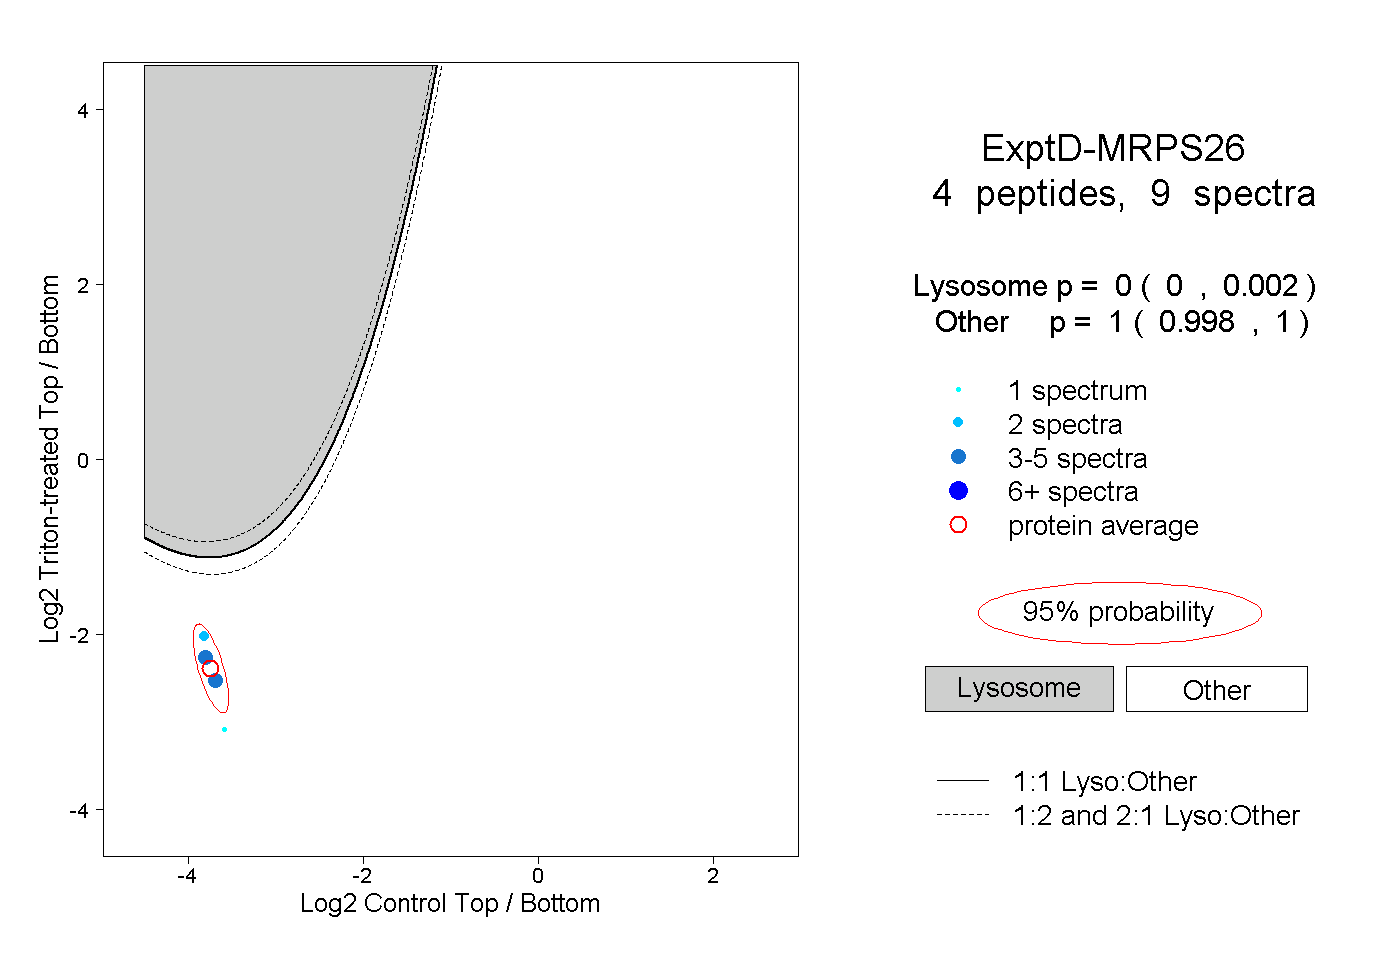 |
0.000 0.000 | 0.002 |
1.000 0.998 | 1.000 |