 38
38peptides
spectra
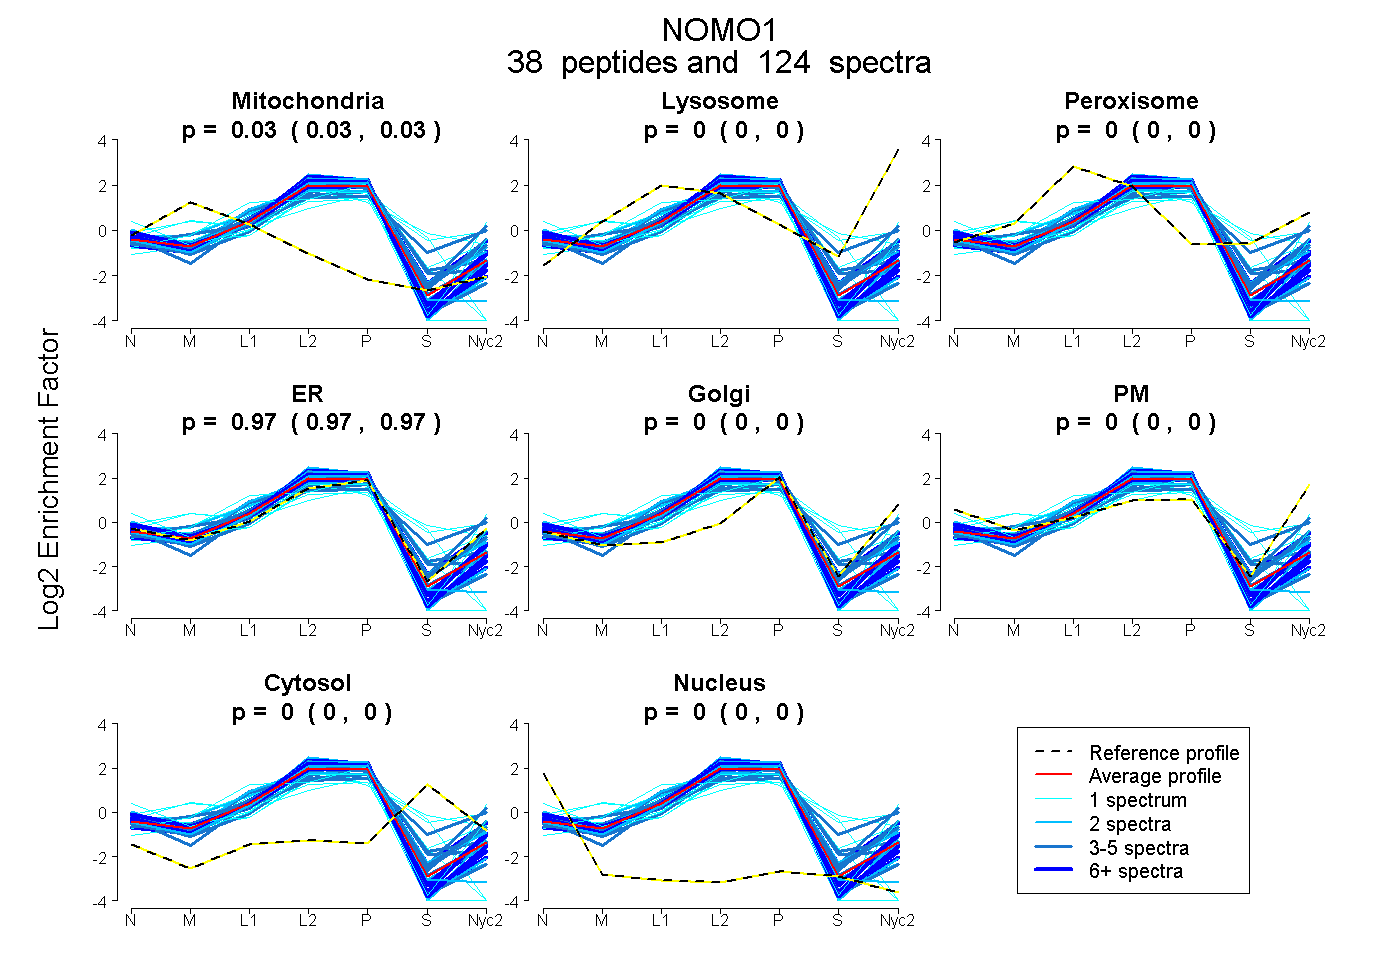
0.027 | 0.030
0.000 | 0.000
0.000 | 0.000
0.970 | 0.973
0.000 | 0.000
0.000 | 0.000
0.000 | 0.000
0.000 | 0.000
16peptides
spectra
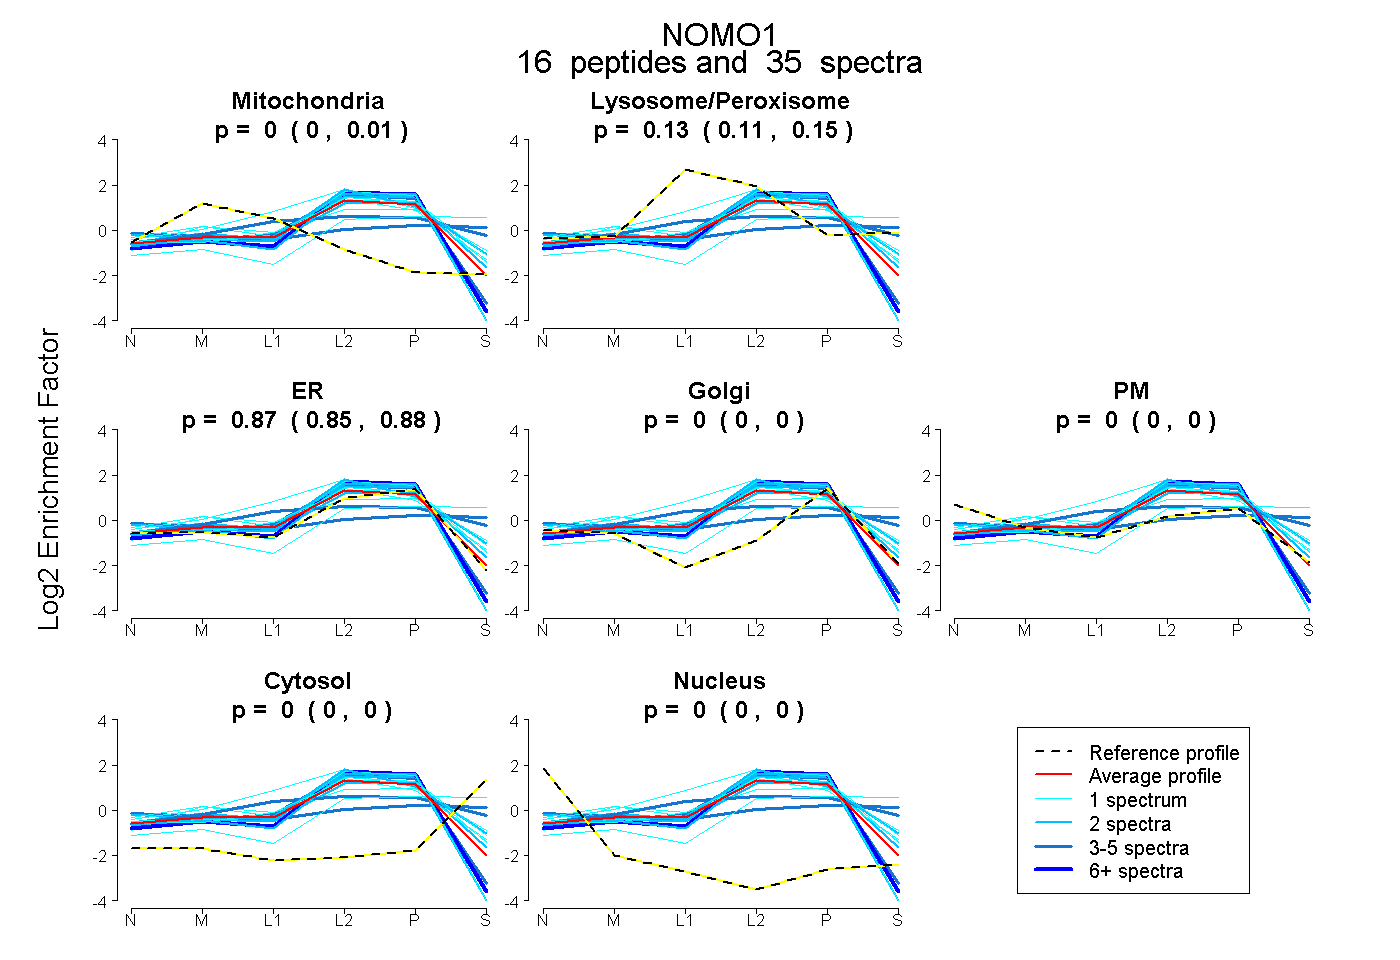
0.000 | 0.007
0.115 | 0.147
0.850 | 0.879
0.000 | 0.000
0.000 | 0.000
0.000 | 0.000
0.000 | 0.000
33peptides
spectra
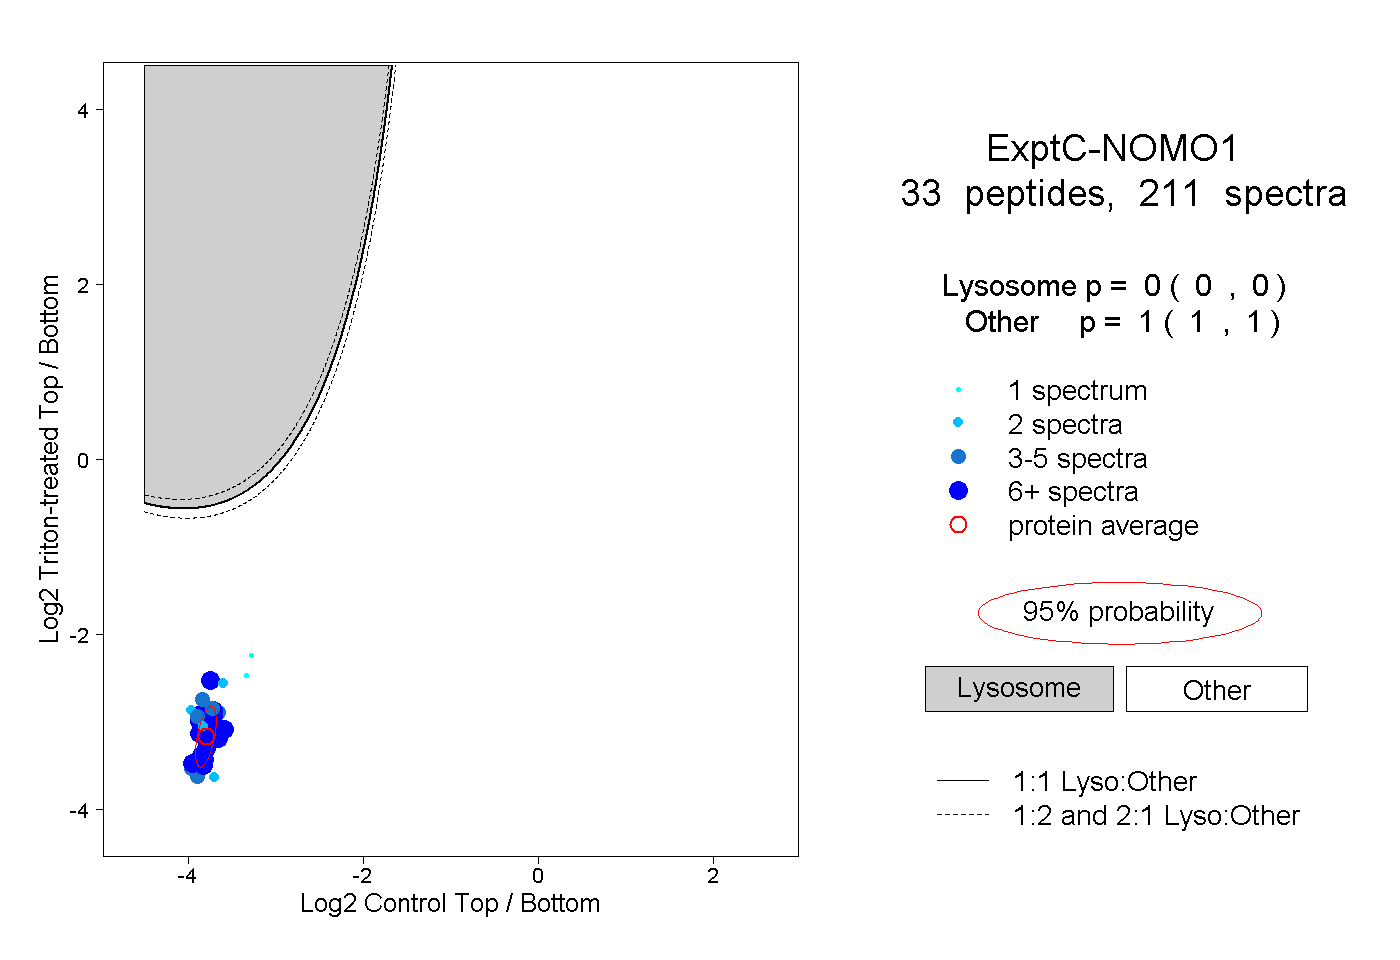
0.000 | 0.000
1.000 | 1.000
8peptides
spectra
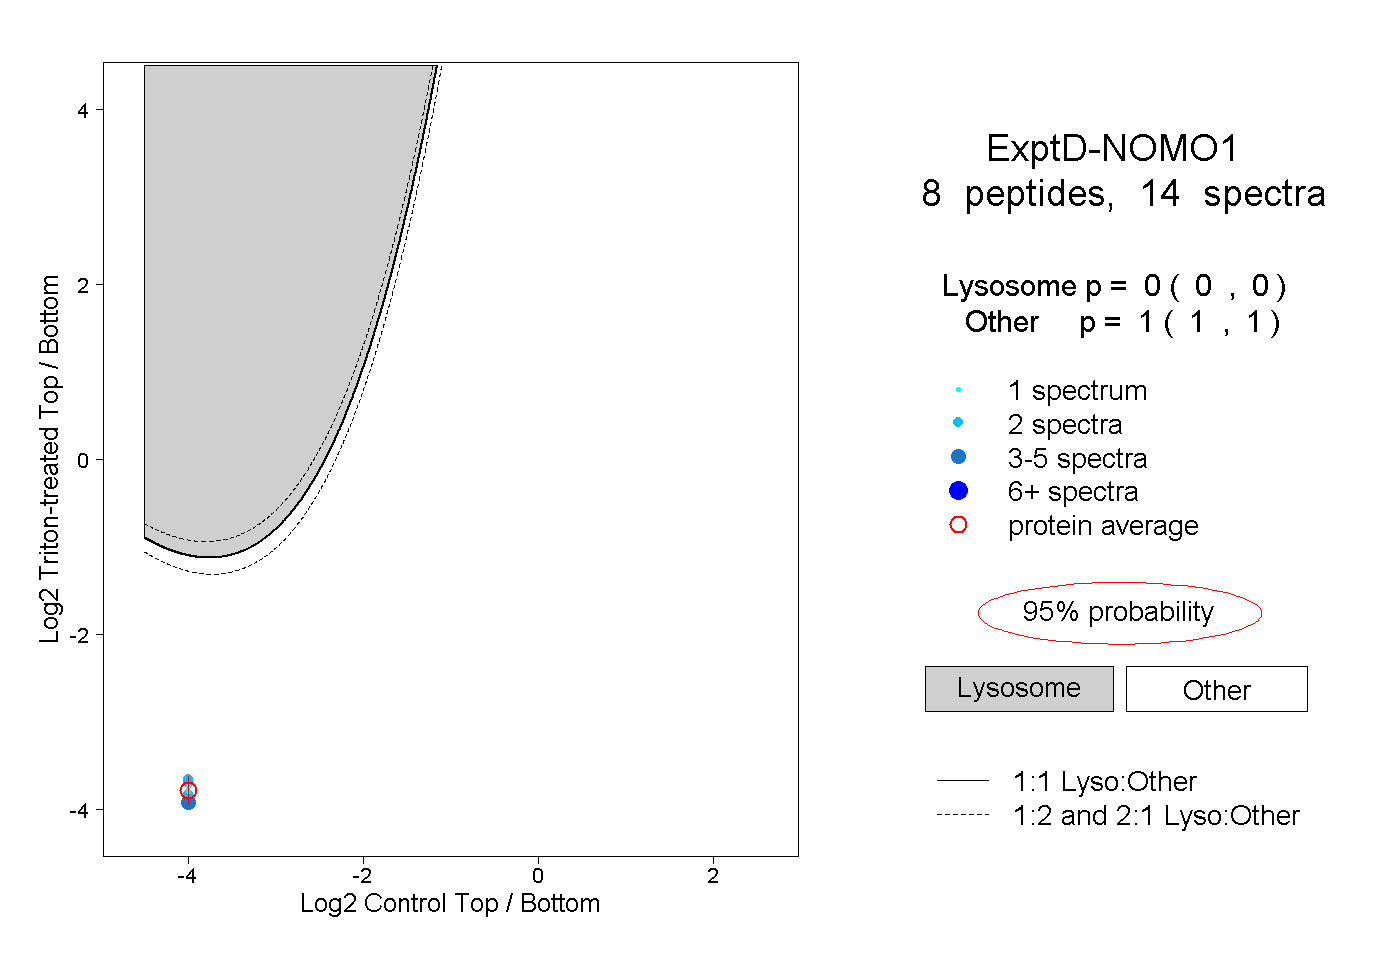
0.000 | 0.000
1.000 | 1.000