| 5 spectra, EQQLAEIETR |
0.000 |
|
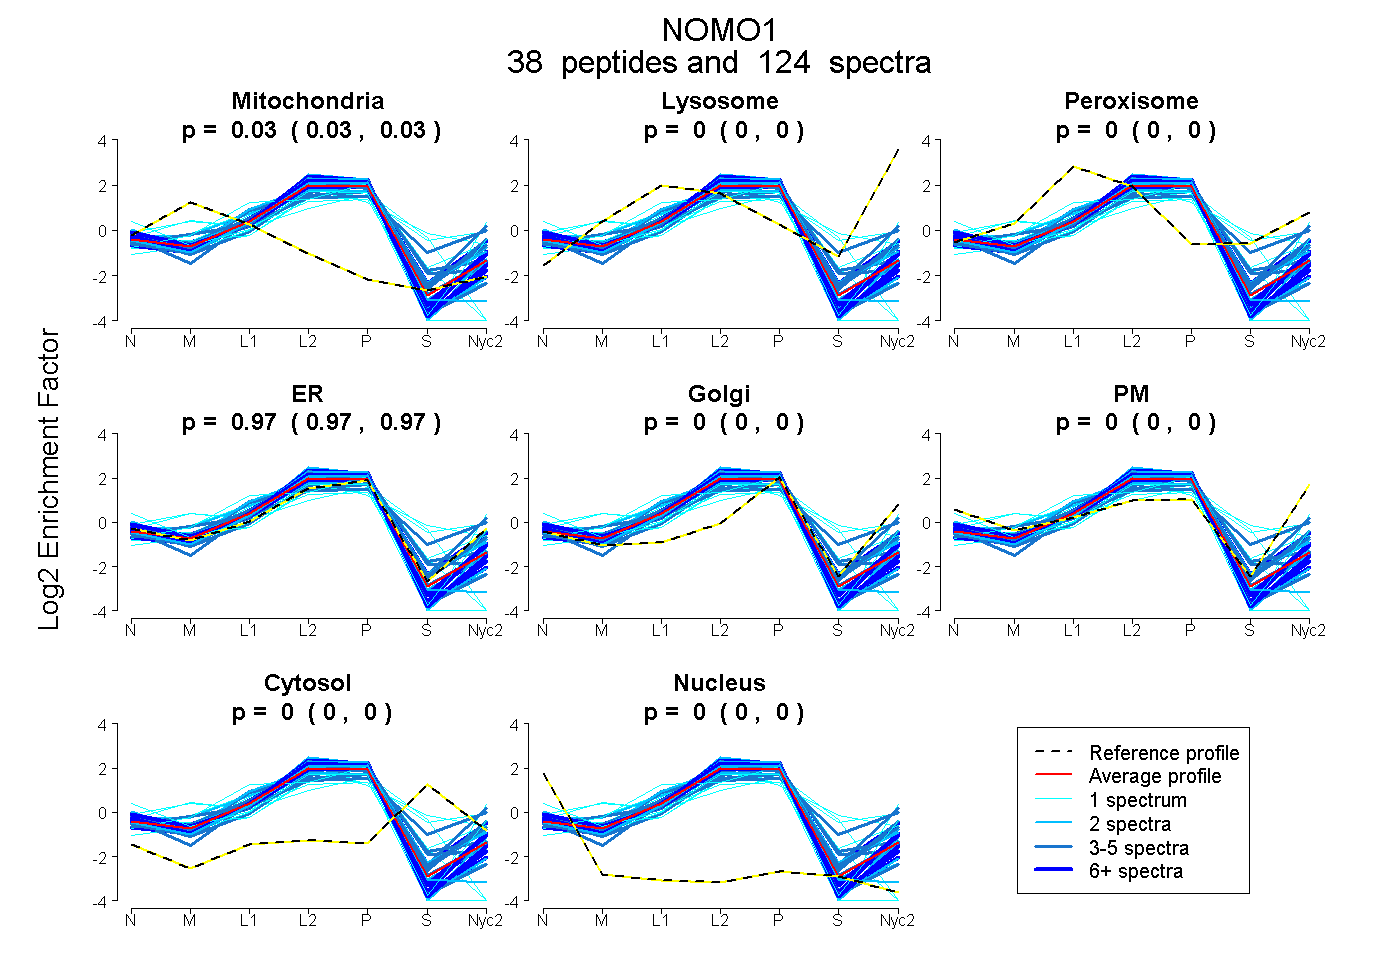
0.023 |
|
0.977 |
0.000 |
0.000 |
0.000 |
0.000 |
|
| 1 spectrum, LDFTVEHDSLR |
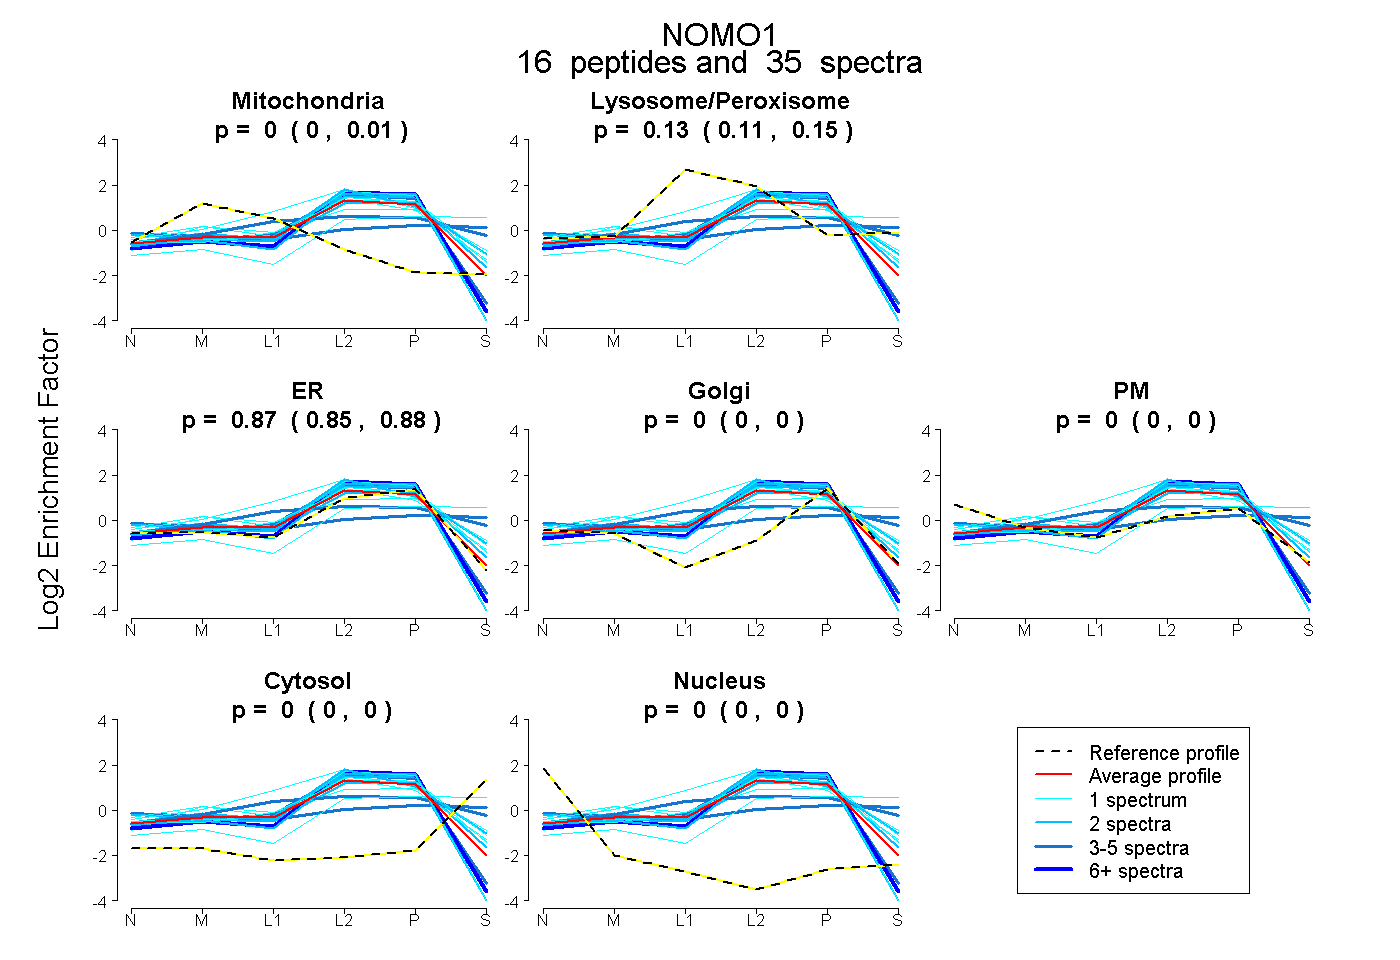
0.000 |
|
0.189 |
|
0.811 |
0.000 |
0.000 |
0.000 |
0.000 |
|
| 1 spectrum, GASSPLITVFTDDK |
0.000 |
|
0.336 |
|
0.415 |
0.202 |
0.000 |
0.047 |
0.000 |
|
| 1 spectrum, VQVVVPEAETR |
0.000 |
|
0.249 |
|
0.716 |
0.005 |
0.000 |
0.030 |
0.000 |
|
| 2 spectra, GQPLGPAGVQVSLR |
0.000 |
|
0.000 |
|
1.000 |
0.000 |
0.000 |
0.000 |
0.000 |
|
| 1 spectrum, SSIDSEPALVLGPLK |
0.000 |
|
0.110 |
|
0.470 |
0.000 |
0.000 |
0.419 |
0.000 |
|
| 2 spectra, ITITGFR |
0.000 |
|
0.000 |
|
1.000 |
0.000 |
0.000 |
0.000 |
0.000 |
|
| 7 spectra, ITFDVAPSR |
0.000 |
|
0.000 |
|
1.000 |
0.000 |
0.000 |
0.000 |
0.000 |
|
| 1 spectrum, LIEIHGK |
0.000 |
|
0.000 |
|
1.000 |
0.000 |
0.000 |
0.000 |
0.000 |
|
| 2 spectra, EASTTVR |
0.000 |
|
0.123 |
|
0.722 |
0.000 |
0.155 |
0.000 |
0.000 |
|
| 2 spectra, VNSMTFTFDK |
0.000 |
|
0.254 |
|
0.722 |
0.000 |
0.000 |
0.024 |
0.000 |
|
| 3 spectra, DGENYVVLLDSTLPR |
0.000 |
|
0.326 |
|
0.000 |
0.183 |
0.240 |
0.251 |
0.000 |
|
| 1 spectrum, GLLPGCMYHVQLK |
0.010 |
|
0.236 |
|
0.618 |
0.000 |
0.134 |
0.002 |
0.000 |
|
| 1 spectrum, HITLVFSPTR |
0.000 |
|
0.447 |
|
0.553 |
0.000 |
0.000 |
0.000 |
0.000 |
|
| 2 spectra, ITVTPSSK |
0.000 |
|
0.000 |
|
1.000 |
0.000 |
0.000 |
0.000 |
0.000 |
|
| 3 spectra, IQSTVTQPGGK |
0.000 |
|
0.542 |
|
0.000 |
0.371 |
0.000 |
0.087 |
0.000 |
|
 38
38