 4
4peptides
spectra
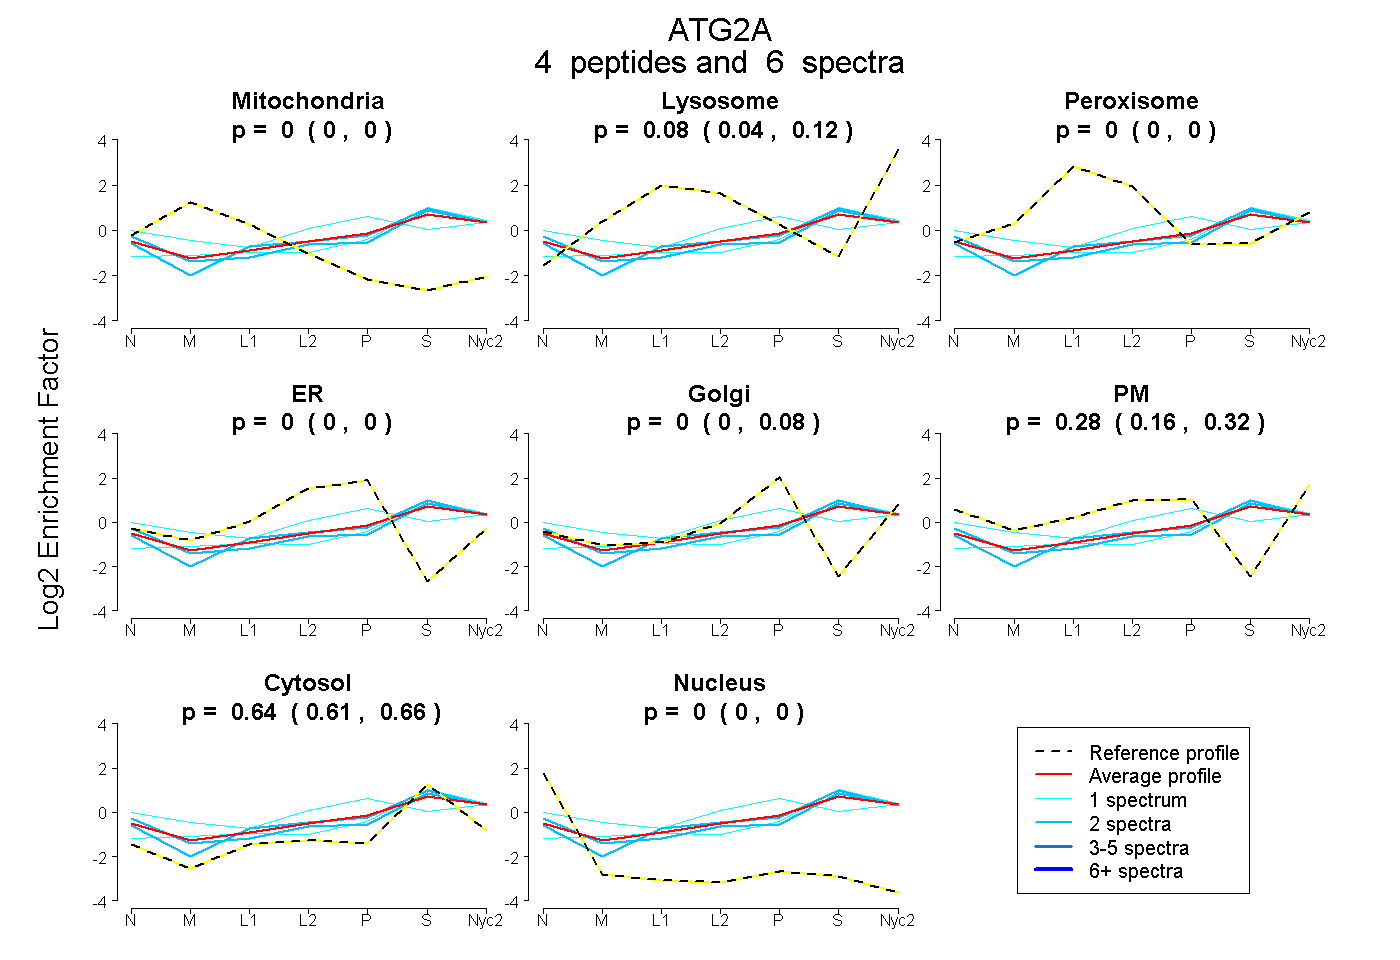
0.000 | 0.000
0.038 | 0.122
0.000 | 0.004
0.000 | 0.000
0.000 | 0.082
0.156 | 0.321
0.606 | 0.661
0.000 | 0.000
2peptides
spectra
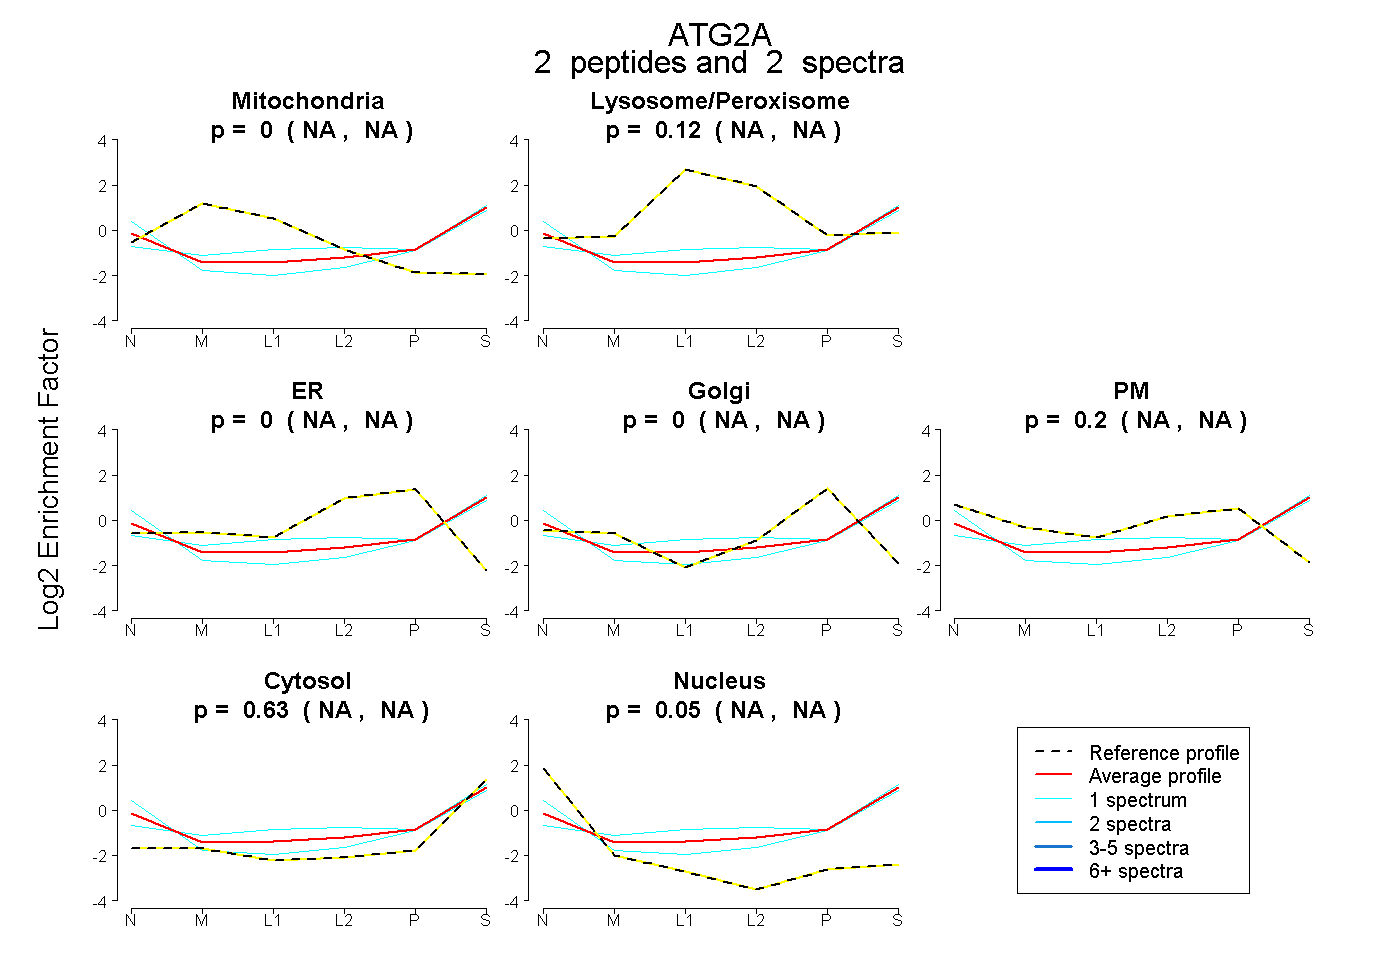
NA | NA
NA | NA
NA | NA
NA | NA
NA | NA
NA | NA
NA | NA
6peptides
spectra
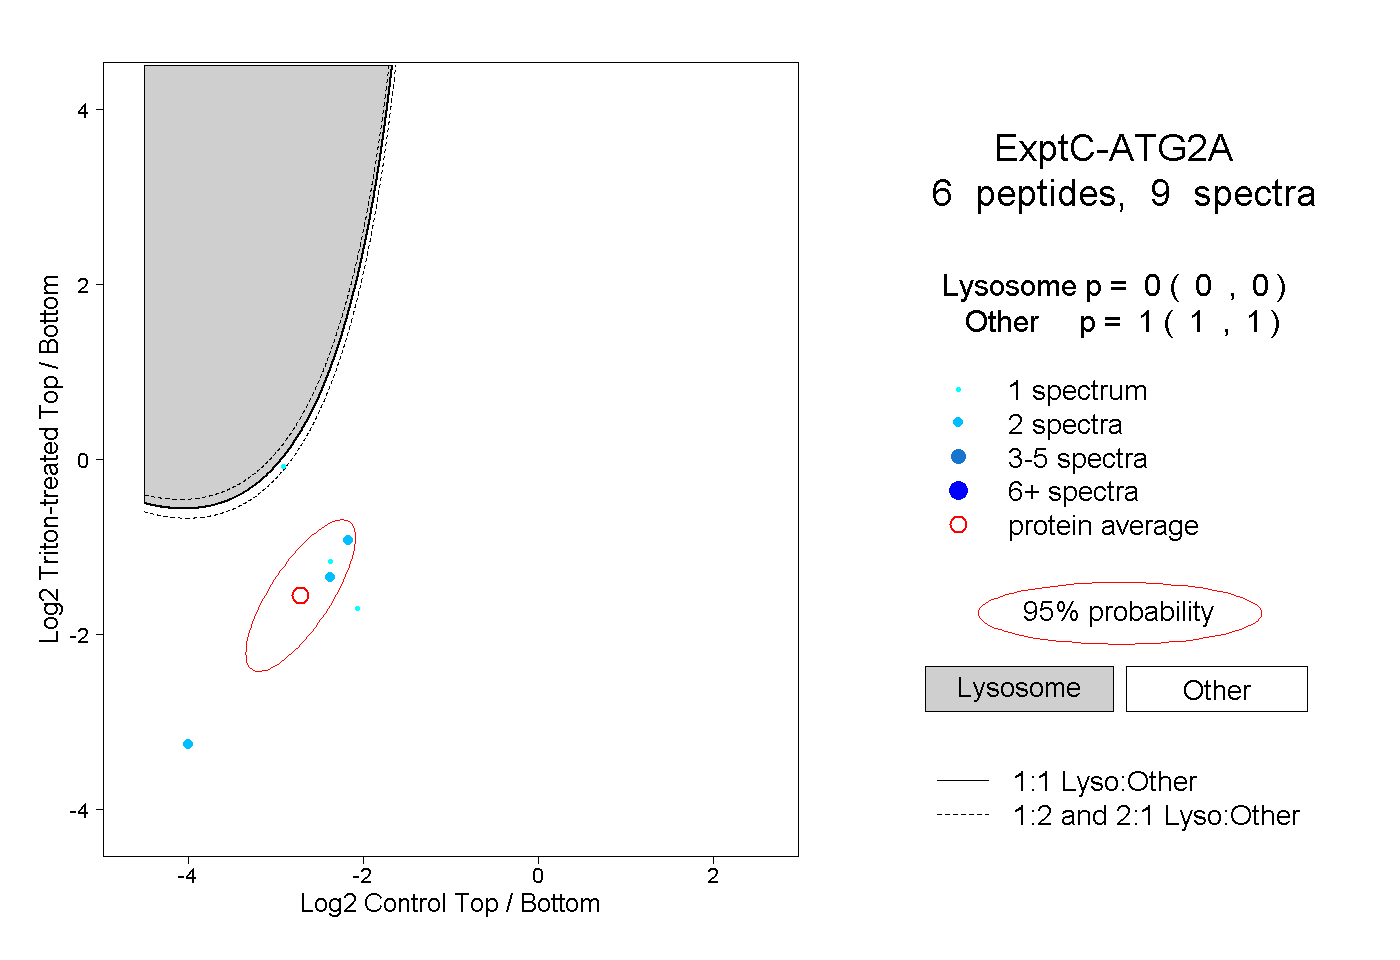
0.000 | 0.000
1.000 | 1.000