 4
4peptides
spectra
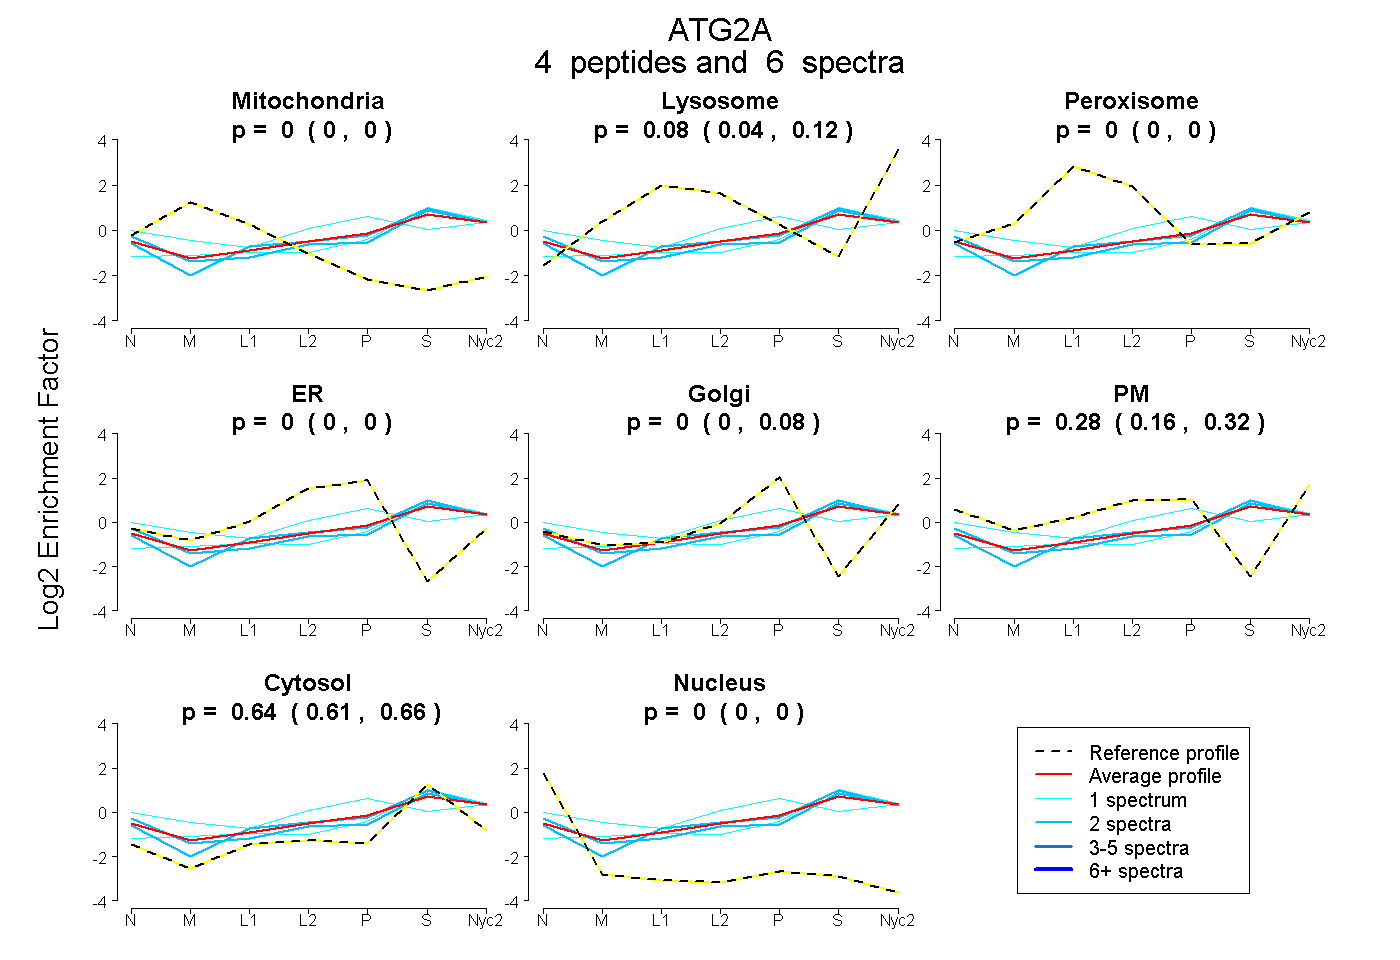
0.000 | 0.000
0.038 | 0.122
0.000 | 0.004
0.000 | 0.000
0.000 | 0.082
0.156 | 0.321
0.606 | 0.661
0.000 | 0.000
| Plot | Mito | Lyso | Perox | ER | Golgi | PM | Cytosol | Nucleus | |||||
| Expt A |
4 peptides |
6 spectra |
|
0.000 0.000 | 0.000 |
0.079 0.038 | 0.122 |
0.000 0.000 | 0.004 |
0.000 0.000 | 0.000 |
0.000 0.000 | 0.082 |
0.280 0.156 | 0.321 |
0.641 0.606 | 0.661 |
0.000 0.000 | 0.000 |
| 2 spectra, LAVLLR | 0.000 | 0.029 | 0.000 | 0.000 | 0.000 | 0.280 | 0.690 | 0.000 | ||
| 1 spectrum, GAASFGSSTASAALELSNR | 0.000 | 0.000 | 0.086 | 0.000 | 0.149 | 0.372 | 0.394 | 0.000 | ||
| 1 spectrum, FPIPDLRPER | 0.000 | 0.206 | 0.000 | 0.000 | 0.086 | 0.000 | 0.708 | 0.000 | ||
| 2 spectra, SSGPNRPQNSWR | 0.000 | 0.101 | 0.000 | 0.000 | 0.000 | 0.196 | 0.703 | 0.000 |
| Plot | Mito | Lyso or Perox | ER | Golgi | PM | Cytosol | Nucleus | ||||||
| Expt B |
2 peptides |
2 spectra |
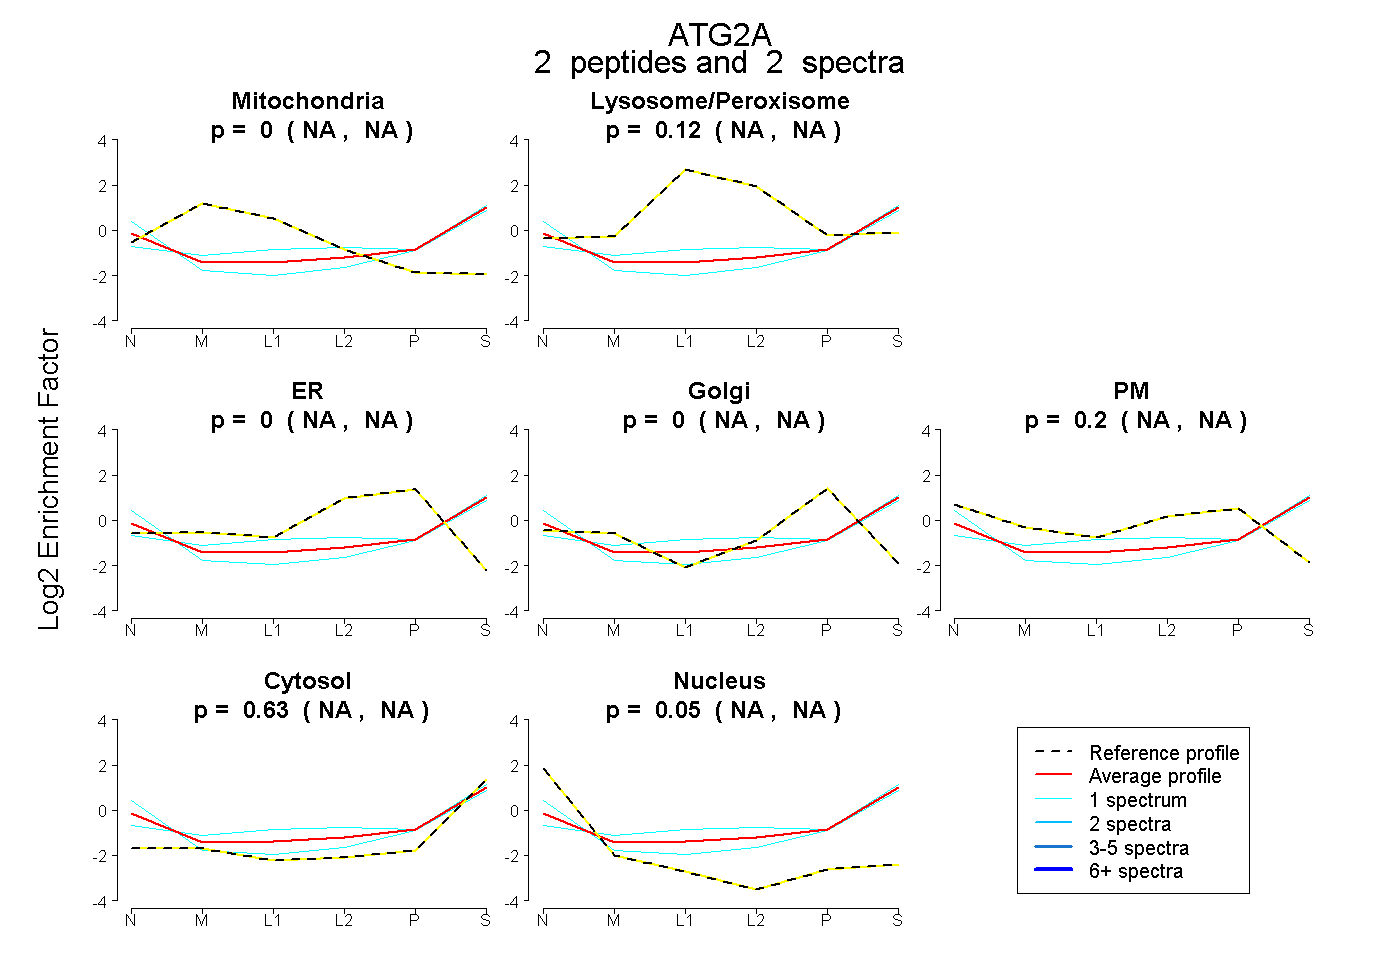 |
0.000 NA | NA |
0.122 NA | NA |
0.000 NA | NA |
0.000 NA | NA |
0.203 NA | NA |
0.626 NA | NA |
0.049 NA | NA |
|||
| Plot | Lyso | Other | |||||||||||
| Expt C |
6 peptides |
9 spectra |
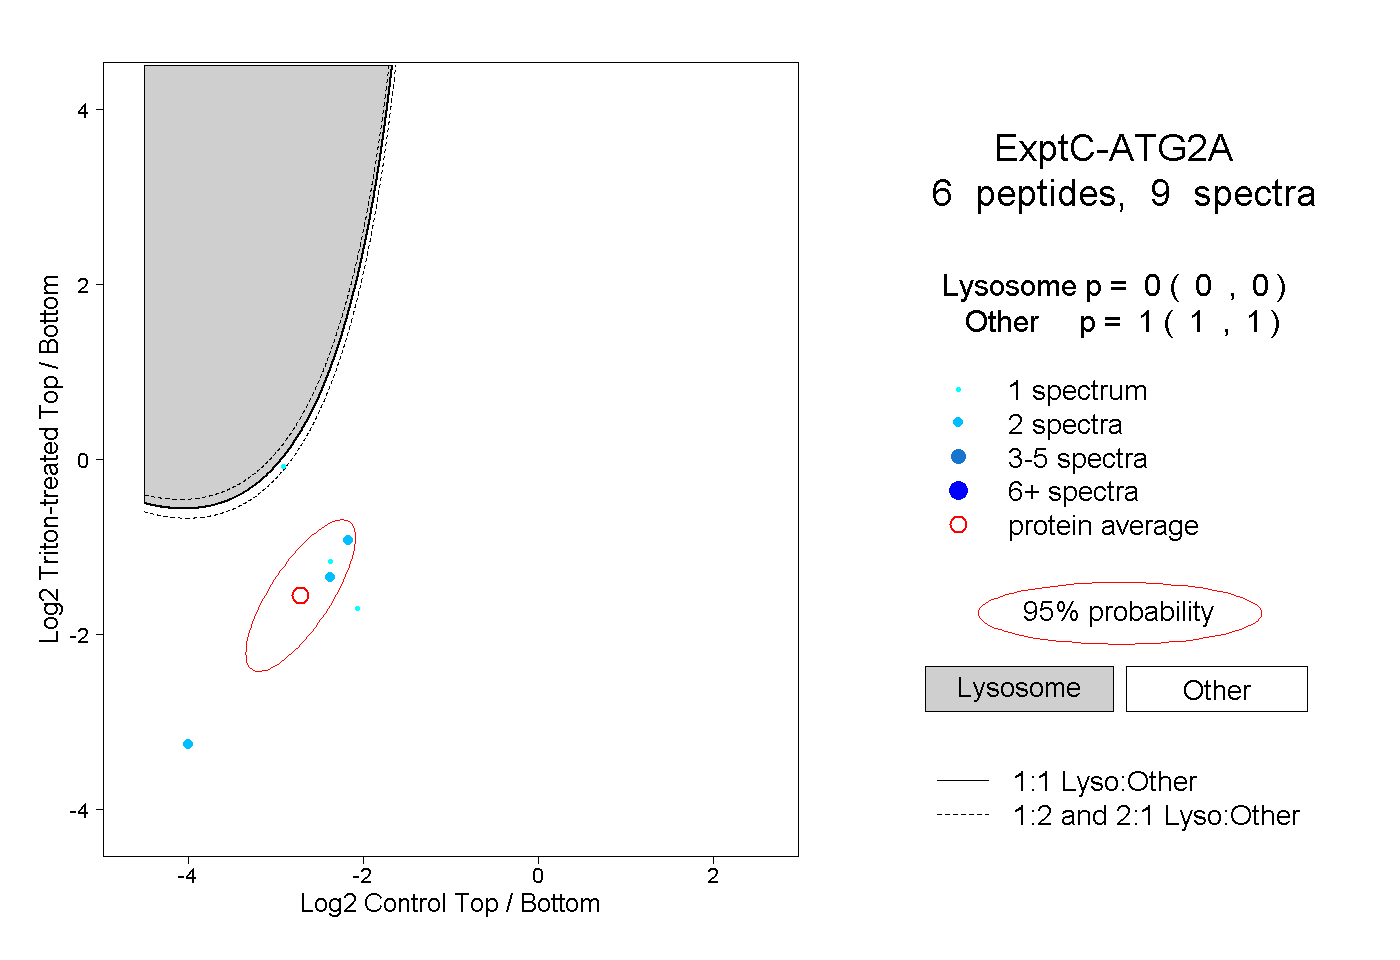 |
0.000 0.000 | 0.000 |
1.000 1.000 | 1.000 |