 7
7peptides
spectra
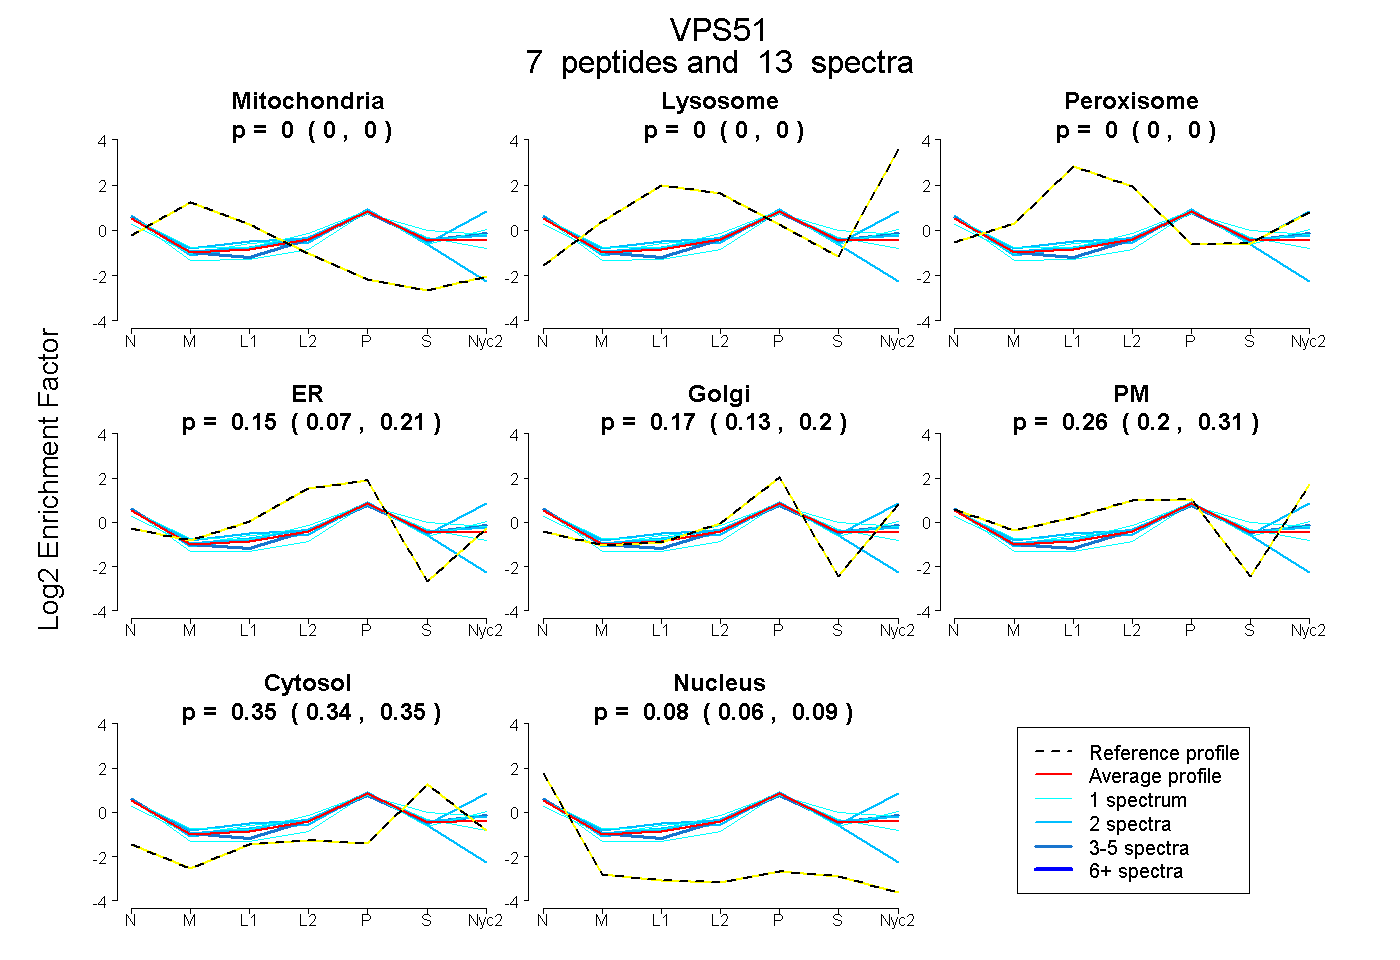
0.000 | 0.000
0.000 | 0.000
0.000 | 0.000
0.073 | 0.212
0.130 | 0.200
0.202 | 0.307
0.338 | 0.352
0.063 | 0.089
4peptides
spectra

0.000 | 0.000
0.019 | 0.132
0.000 | 0.000
0.179 | 0.445
0.164 | 0.494
0.188 | 0.302
0.000 | 0.000
7peptides
spectra
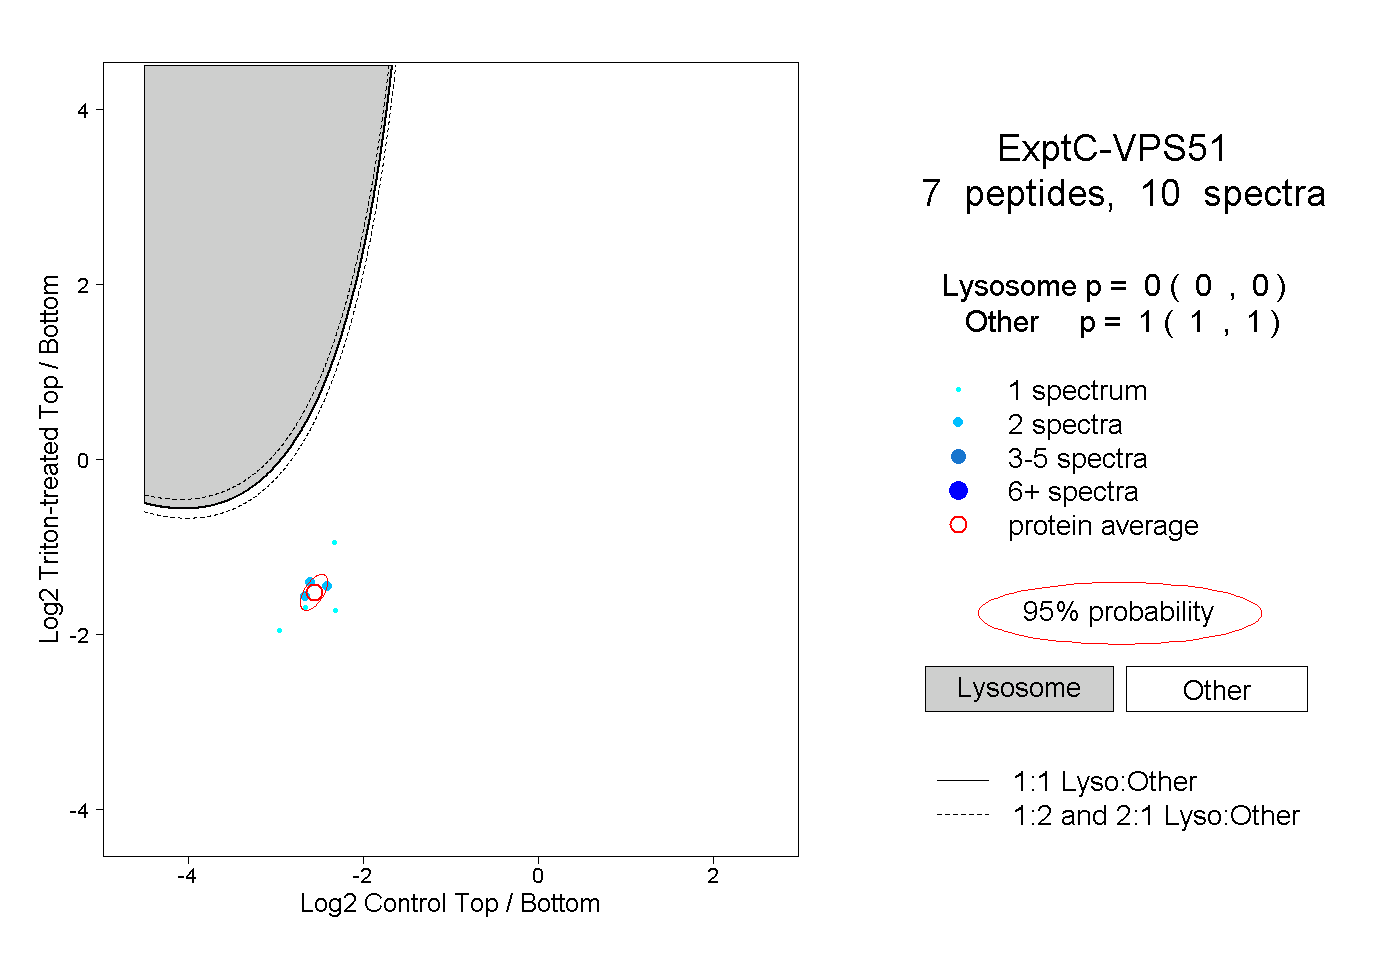
0.000 | 0.000
1.000 | 1.000