 7
7peptides
spectra
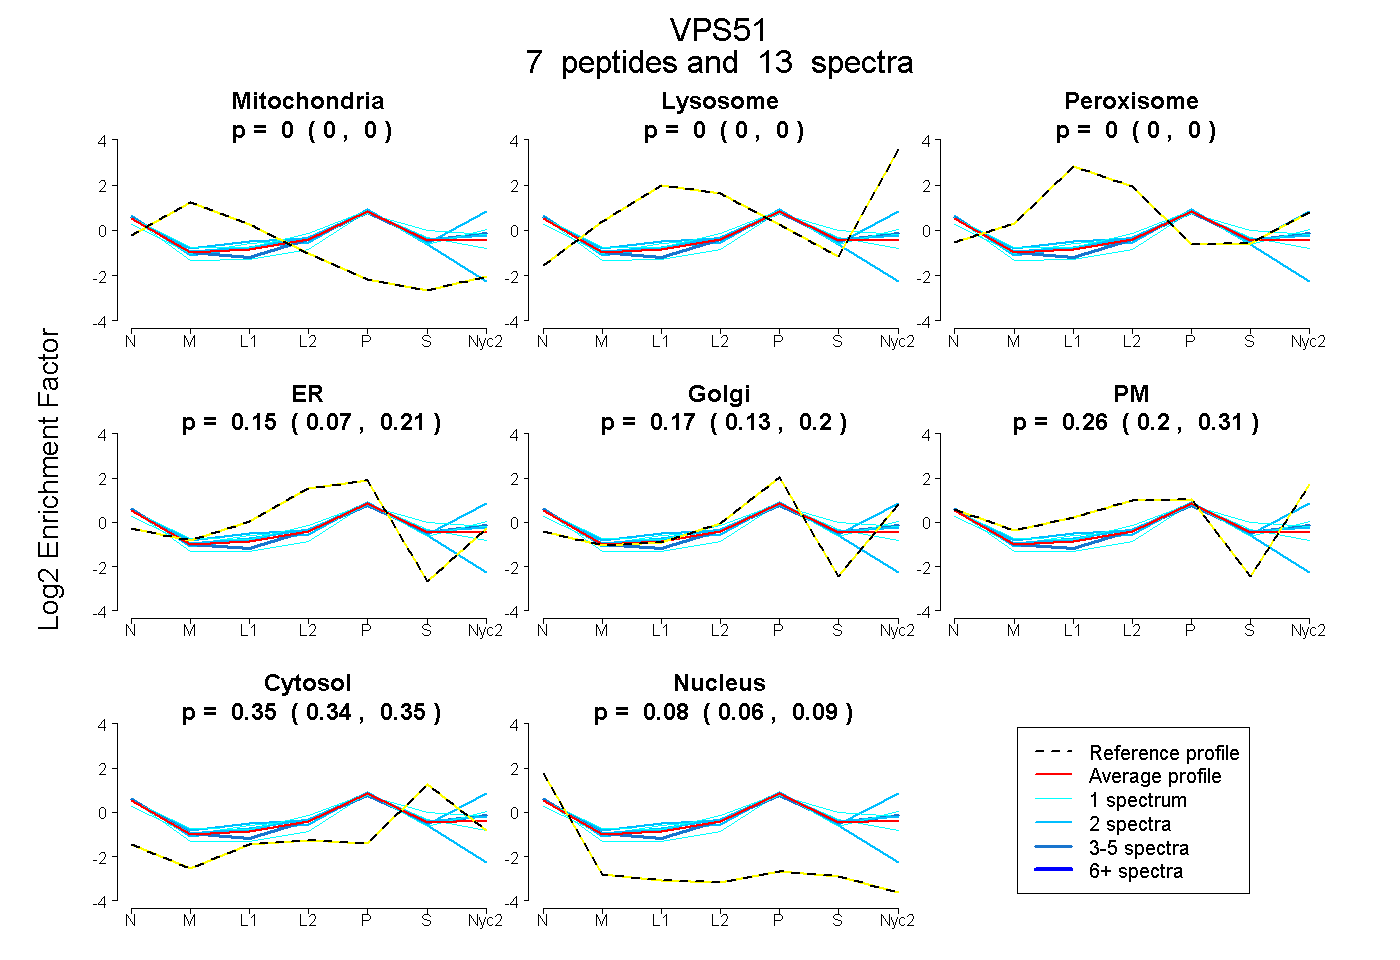
0.000 | 0.000
0.000 | 0.000
0.000 | 0.000
0.073 | 0.212
0.130 | 0.200
0.202 | 0.307
0.338 | 0.352
0.063 | 0.089
| Plot | Mito | Lyso | Perox | ER | Golgi | PM | Cytosol | Nucleus | |||||
| Expt A |
7 peptides |
13 spectra |
|
0.000 0.000 | 0.000 |
0.000 0.000 | 0.000 |
0.000 0.000 | 0.000 |
0.148 0.073 | 0.212 |
0.167 0.130 | 0.200 |
0.262 0.202 | 0.307 |
0.346 0.338 | 0.352 |
0.077 0.063 | 0.089 |
| 1 spectrum, VQGLVISQMLR | 0.000 | 0.000 | 0.000 | 0.093 | 0.140 | 0.411 | 0.306 | 0.050 | ||
| 1 spectrum, LLTHYVK | 0.000 | 0.000 | 0.046 | 0.086 | 0.184 | 0.238 | 0.434 | 0.011 | ||
| 4 spectra, LAGVHALLR | 0.000 | 0.000 | 0.000 | 0.011 | 0.264 | 0.310 | 0.340 | 0.076 | ||
| 2 spectra, ISATLQDR | 0.000 | 0.000 | 0.000 | 0.000 | 0.125 | 0.550 | 0.325 | 0.000 | ||
| 1 spectrum, GGATPPALLLLLSR | 0.000 | 0.000 | 0.000 | 0.105 | 0.362 | 0.046 | 0.356 | 0.132 | ||
| 2 spectra, QALAAPR | 0.000 | 0.000 | 0.000 | 0.123 | 0.140 | 0.325 | 0.359 | 0.053 | ||
| 2 spectra, AIQDDCQVITAR | 0.018 | 0.000 | 0.000 | 0.495 | 0.000 | 0.000 | 0.271 | 0.216 |
| Plot | Mito | Lyso or Perox | ER | Golgi | PM | Cytosol | Nucleus | ||||||
| Expt B |
4 peptides |
6 spectra |
 |
0.000 0.000 | 0.000 |
0.078 0.019 | 0.132 |
0.000 0.000 | 0.000 |
0.325 0.179 | 0.445 |
0.349 0.164 | 0.494 |
0.248 0.188 | 0.302 |
0.000 0.000 | 0.000 |
|||
| Plot | Lyso | Other | |||||||||||
| Expt C |
7 peptides |
10 spectra |
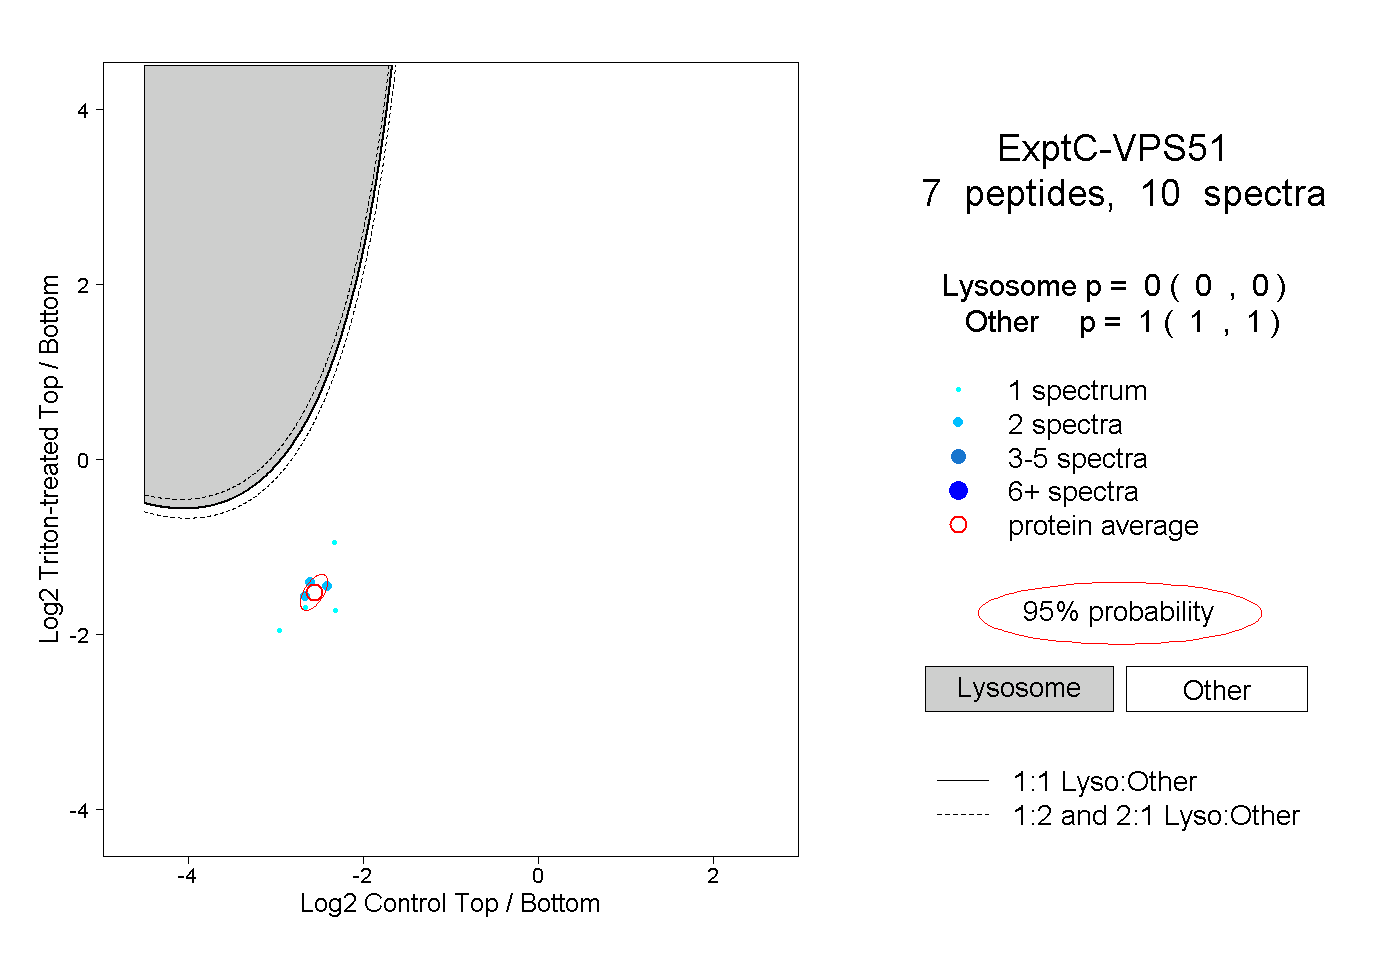 |
0.000 0.000 | 0.000 |
1.000 1.000 | 1.000 |