 5
5peptides
spectra
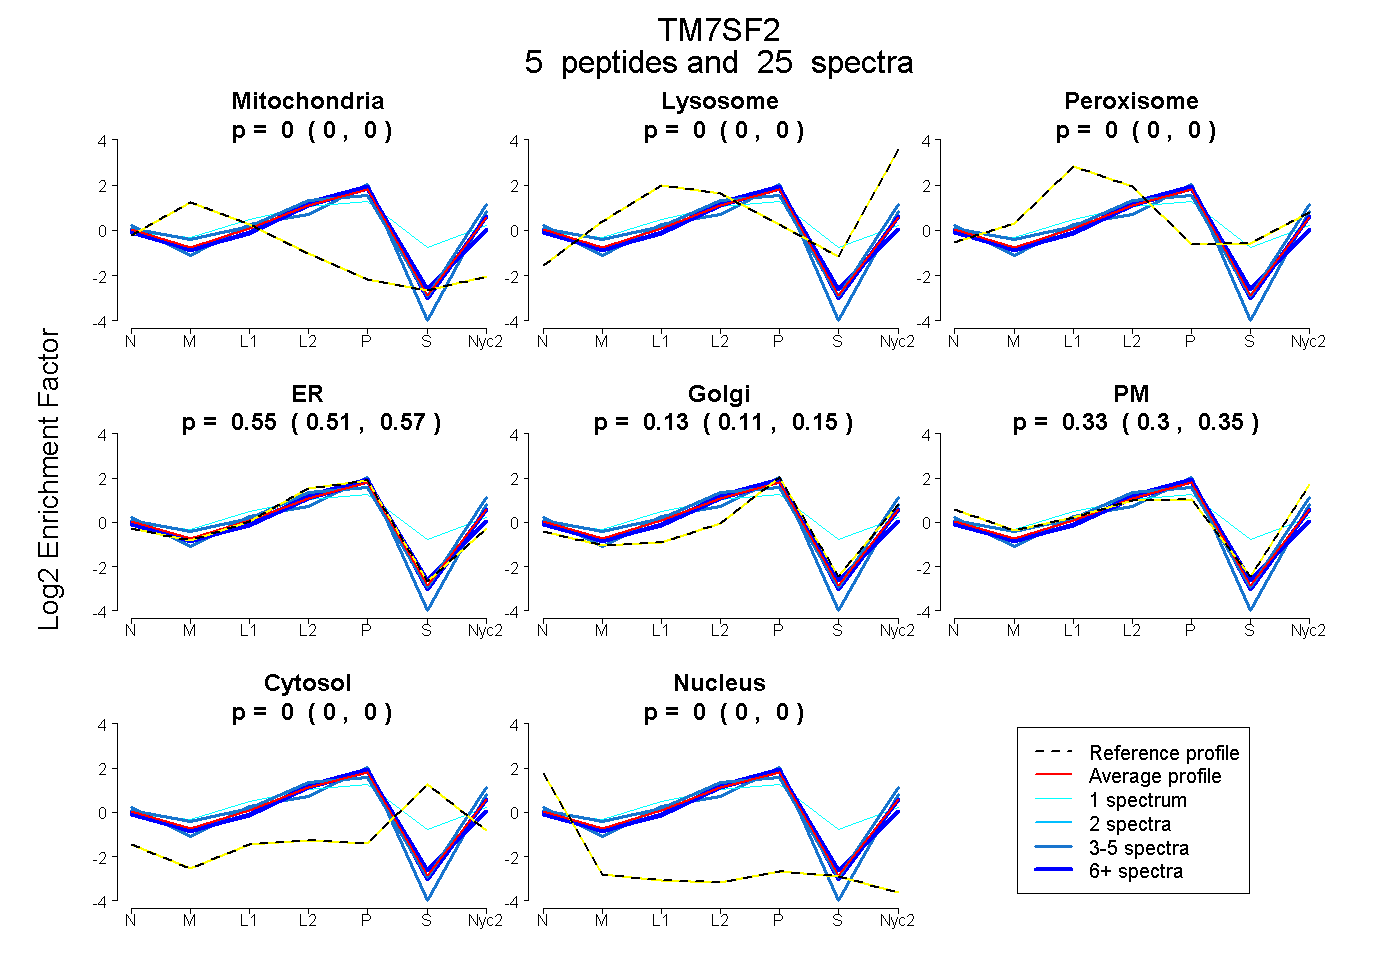
0.000 | 0.000
0.000 | 0.000
0.000 | 0.000
0.515 | 0.573
0.106 | 0.145
0.299 | 0.349
0.000 | 0.000
0.000 | 0.000
4peptides
spectra
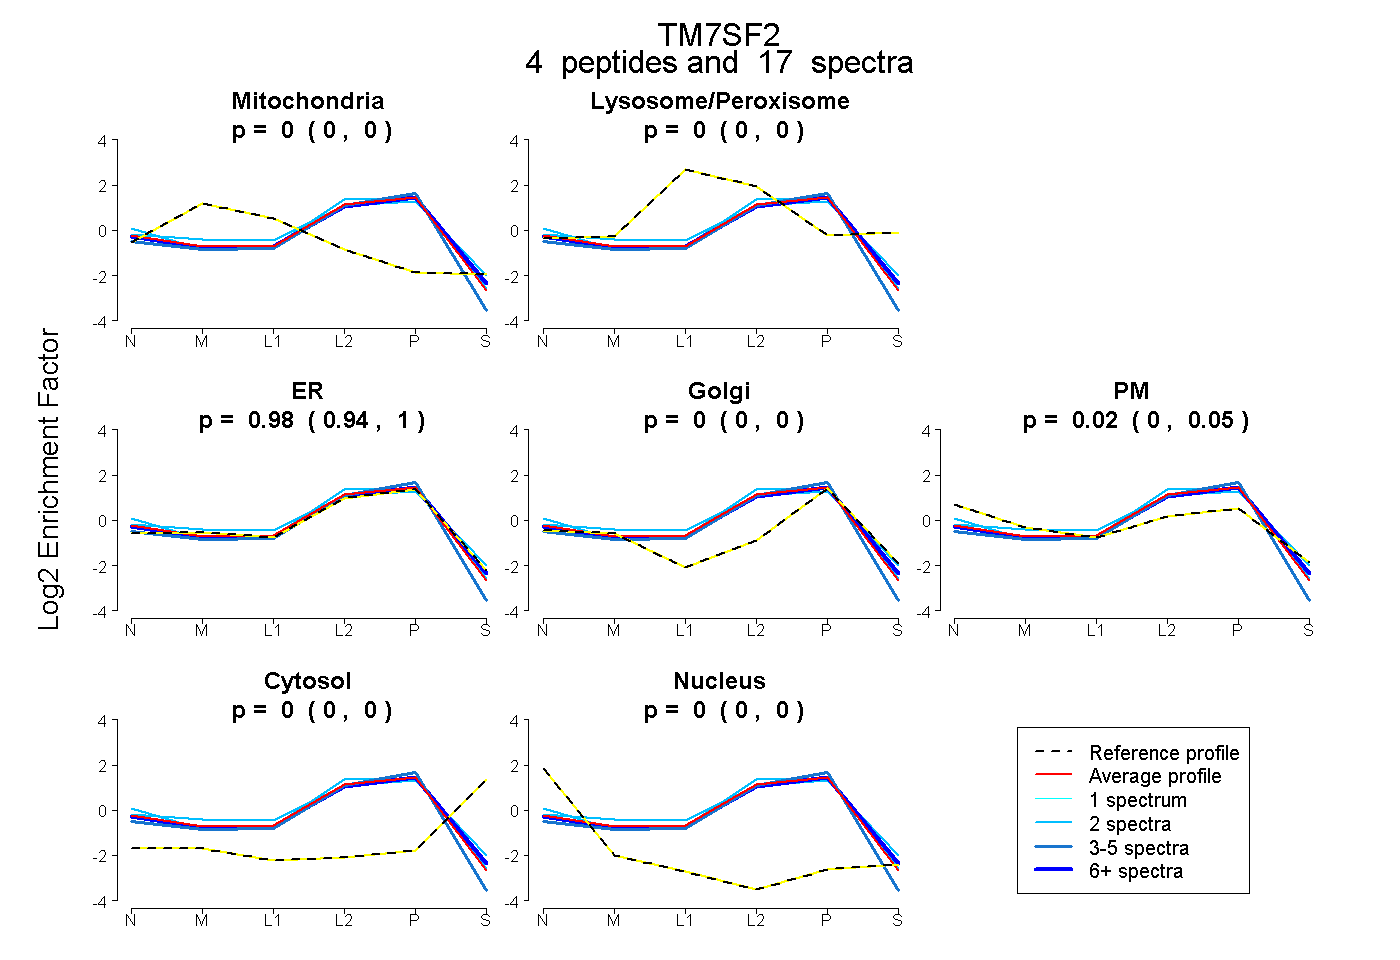
0.000 | 0.000
0.000 | 0.000
0.945 | 1.000
0.000 | 0.000
0.000 | 0.051
0.000 | 0.000
0.000 | 0.000
7peptides
spectra
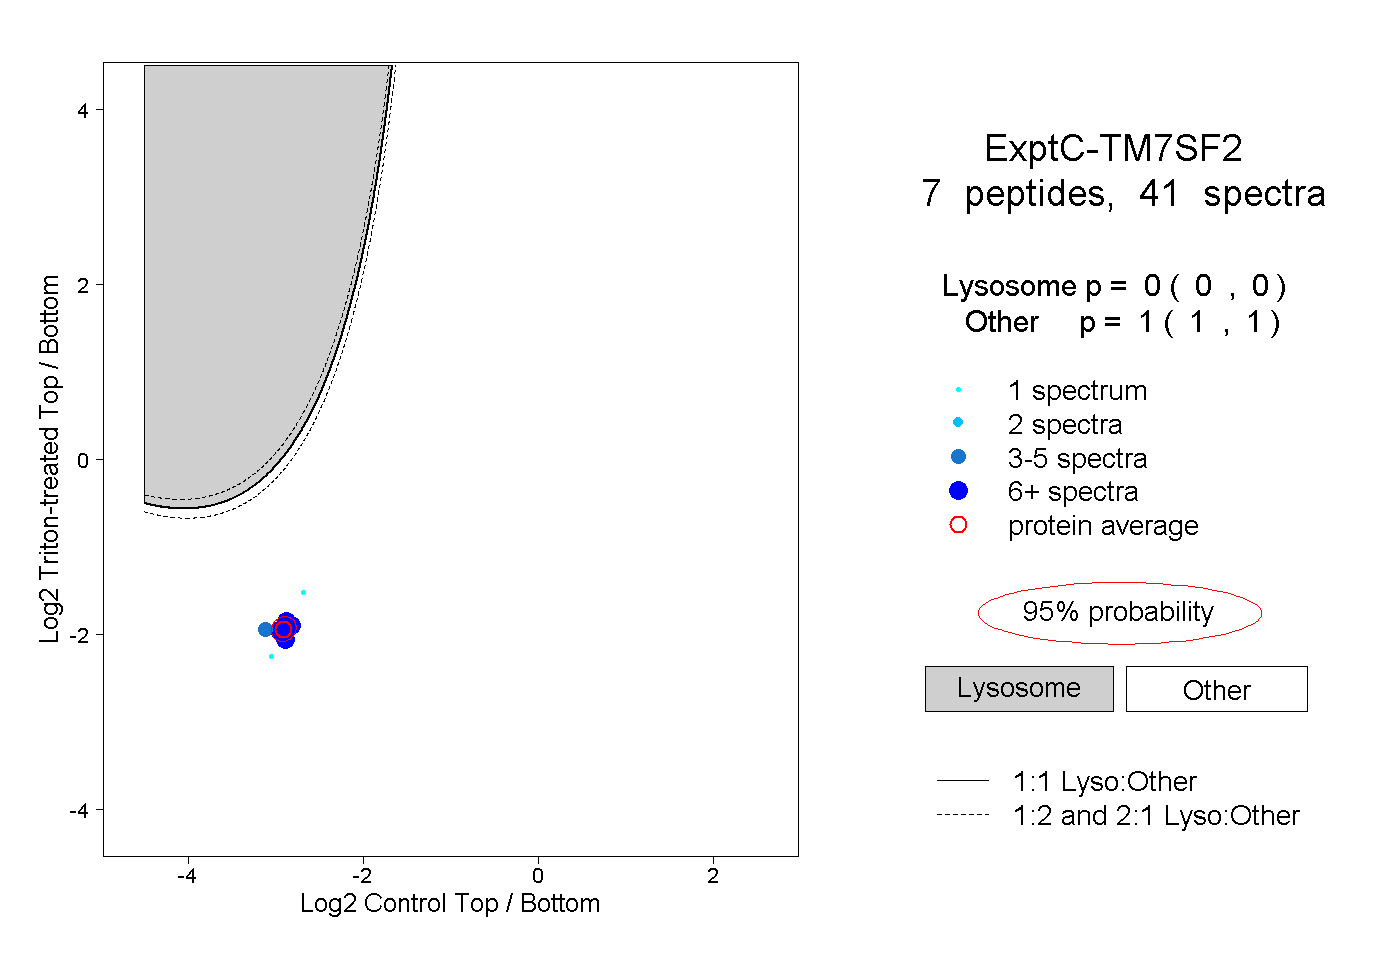
0.000 | 0.000
1.000 | 1.000
1peptide
spectrum
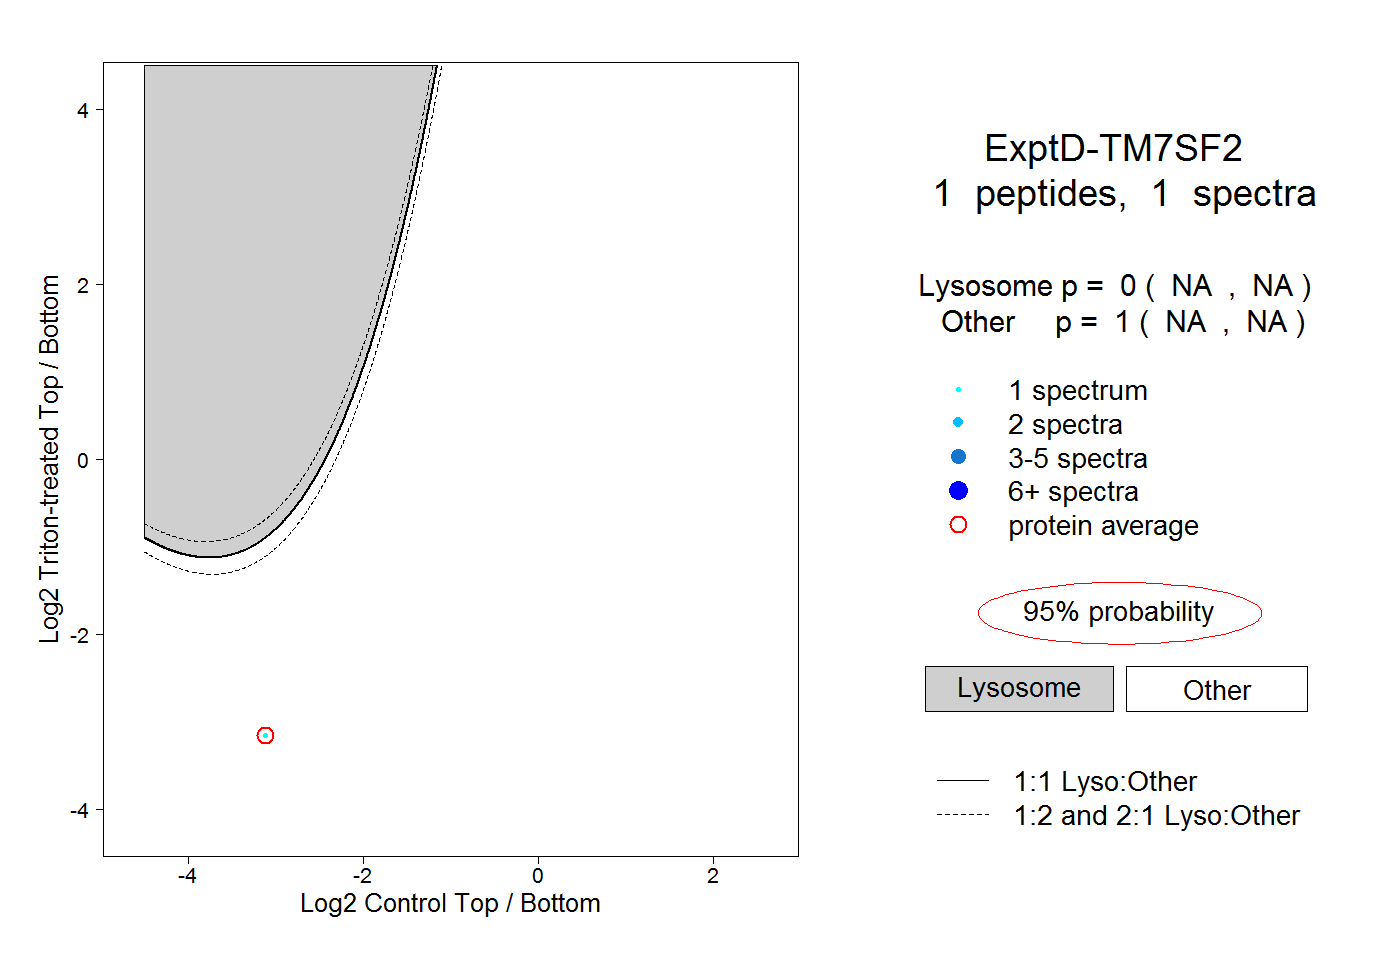
NA | NA
NA | NA