 5
5peptides
spectra
0.000 | 0.000
0.000 | 0.000
0.000 | 0.000
0.515 | 0.573
0.106 | 0.145
0.299 | 0.349
0.000 | 0.000
0.000 | 0.000
| Plot | Mito | Lyso | Perox | ER | Golgi | PM | Cytosol | Nucleus | |||||
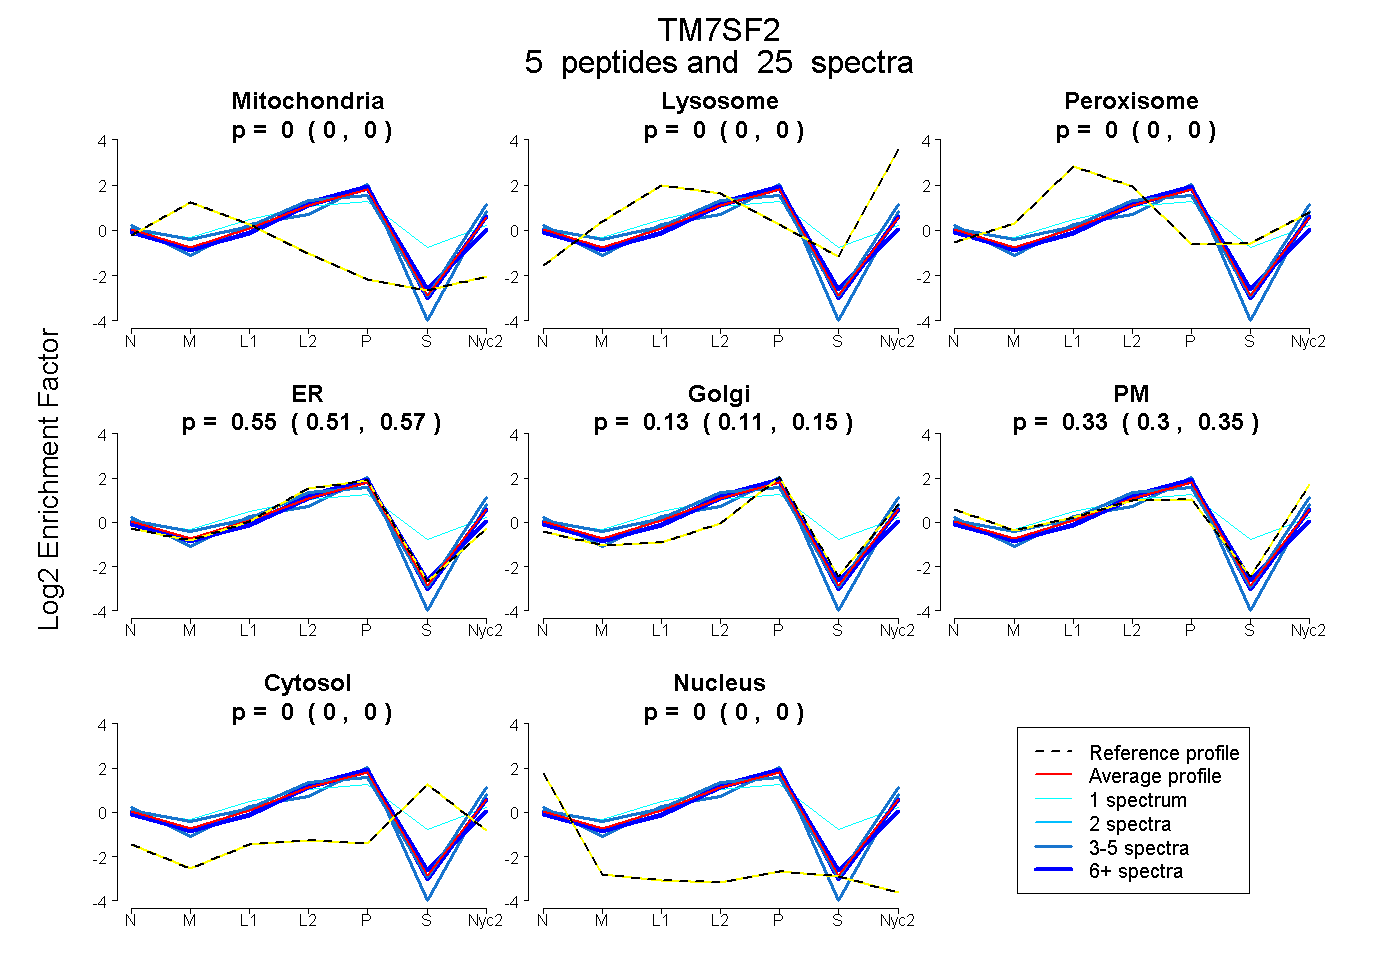
| Expt A |
5 peptides |
25 spectra |
|
0.000 0.000 | 0.000 |
0.000 0.000 | 0.000 |
0.000 0.000 | 0.000 |
0.546 0.515 | 0.573 |
0.127 0.106 | 0.145 |
0.326 0.299 | 0.349 |
0.000 0.000 | 0.000 |
0.000 0.000 | 0.000 |
| 10 spectra, DEQQCLR | 0.000 | 0.000 | 0.000 | 0.712 | 0.175 | 0.096 | 0.000 | 0.017 | ||
| 3 spectra, AVGYYIFR | 0.000 | 0.000 | 0.000 | 0.430 | 0.242 | 0.329 | 0.000 | 0.000 | ||
| 6 spectra, LGSFDFK | 0.000 | 0.000 | 0.000 | 0.567 | 0.162 | 0.271 | 0.000 | 0.000 | ||
| 5 spectra, VAEGLELK | 0.000 | 0.022 | 0.000 | 0.395 | 0.000 | 0.583 | 0.000 | 0.000 | ||
| 1 spectrum, AWQEYCK | 0.000 | 0.000 | 0.346 | 0.293 | 0.258 | 0.000 | 0.103 | 0.000 |
| Plot | Mito | Lyso or Perox | ER | Golgi | PM | Cytosol | Nucleus | ||||||
| Expt B |
4 peptides |
17 spectra |
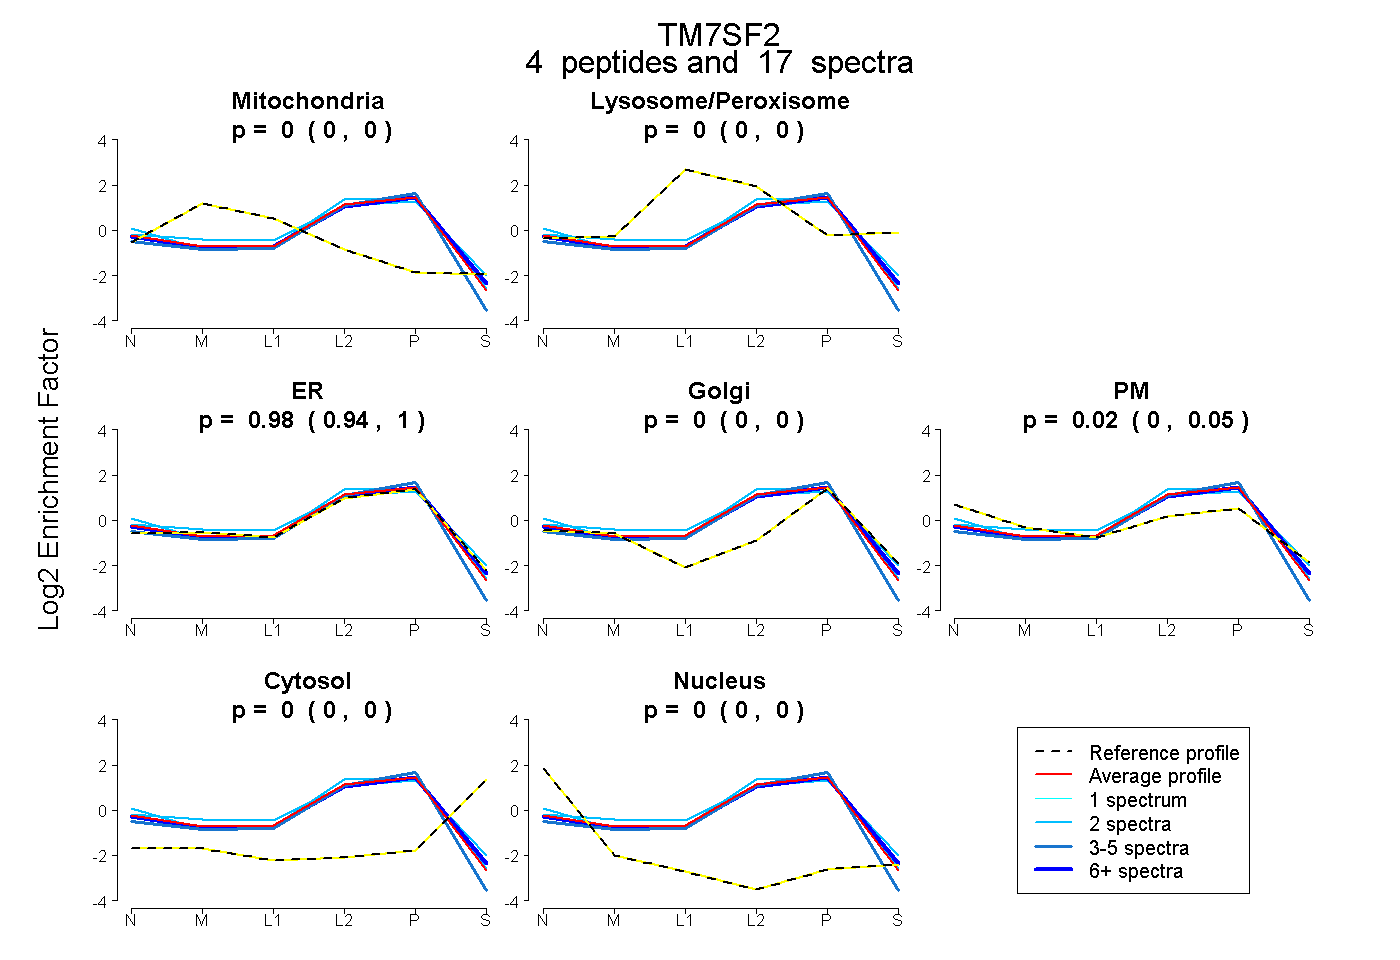 |
0.000 0.000 | 0.000 |
0.000 0.000 | 0.000 |
0.975 0.945 | 1.000 |
0.000 0.000 | 0.000 |
0.025 0.000 | 0.051 |
0.000 0.000 | 0.000 |
0.000 0.000 | 0.000 |
|||
| Plot | Lyso | Other | |||||||||||
| Expt C |
7 peptides |
41 spectra |
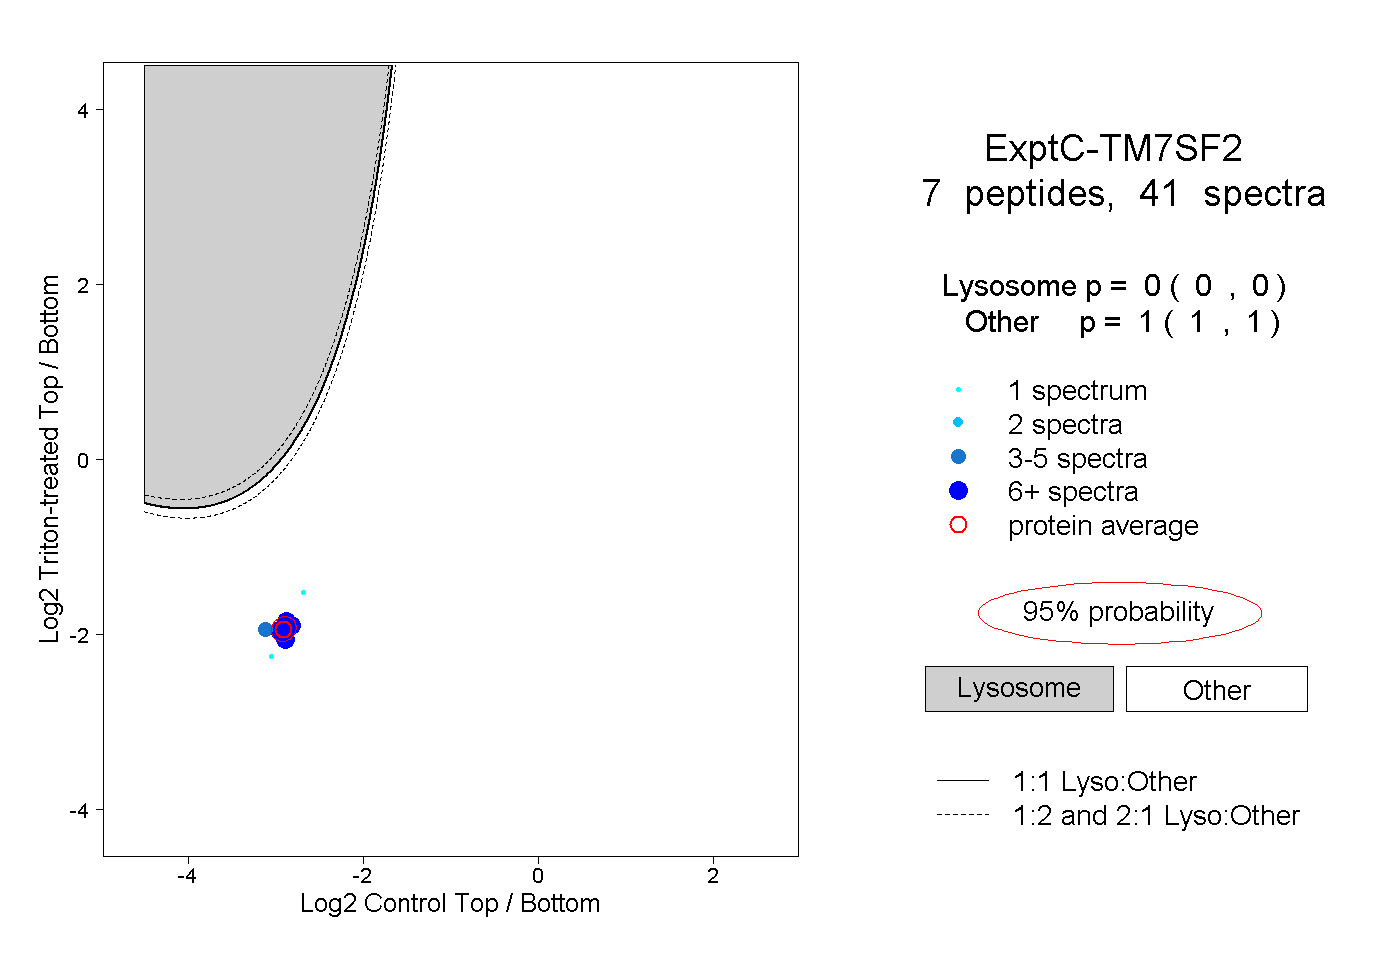 |
0.000 0.000 | 0.000 |
1.000 1.000 | 1.000 |
||||||||
| Plot | Lyso | Other | |||||||||||
| Expt D |
1 peptide |
1 spectrum |
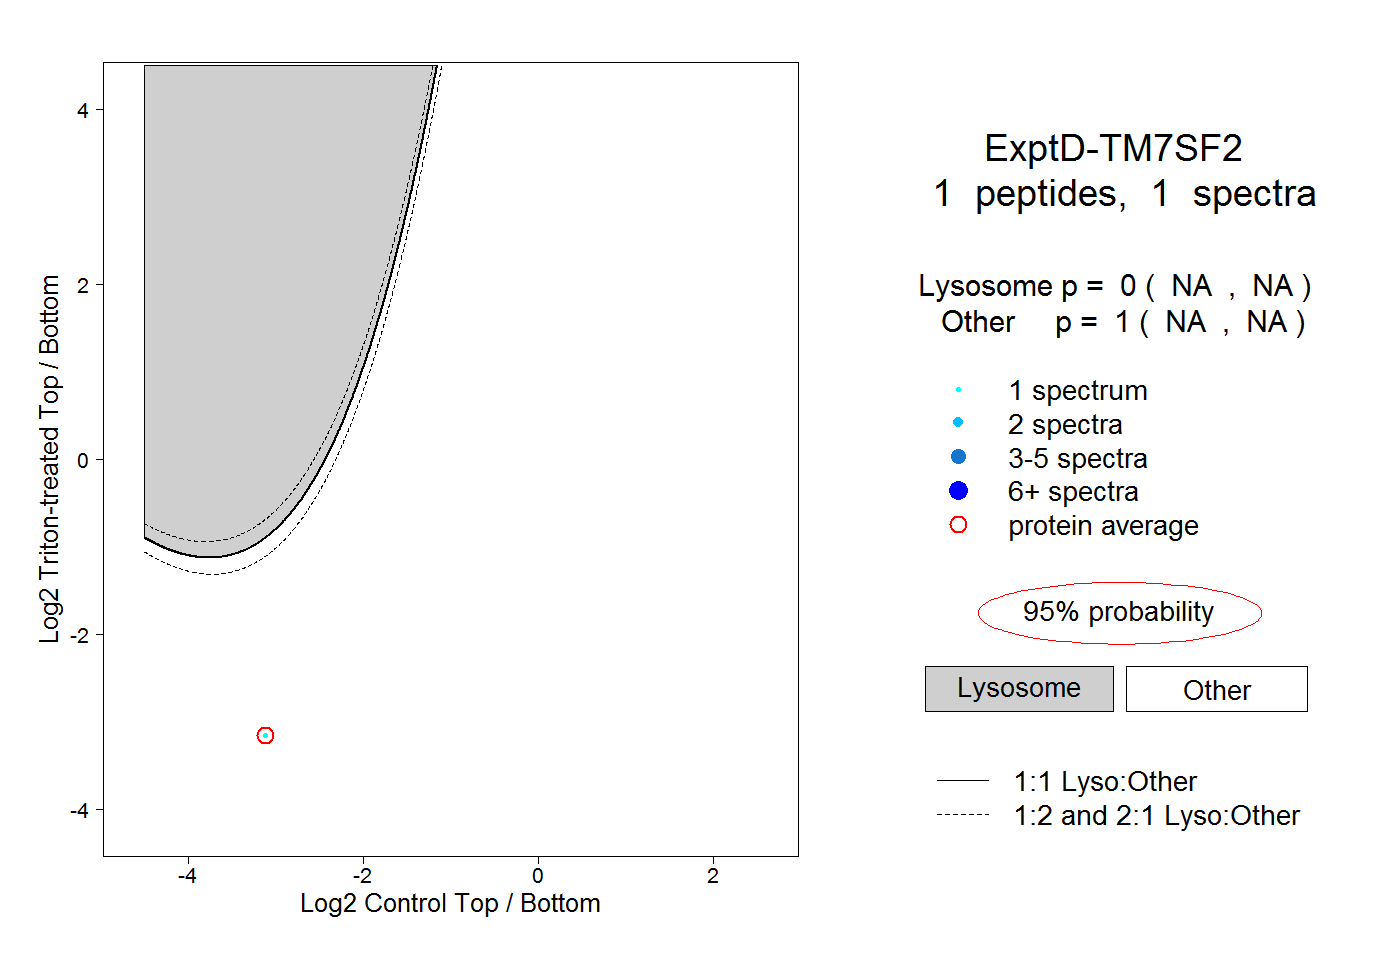 |
0.000 NA | NA |
1.000 NA | NA |