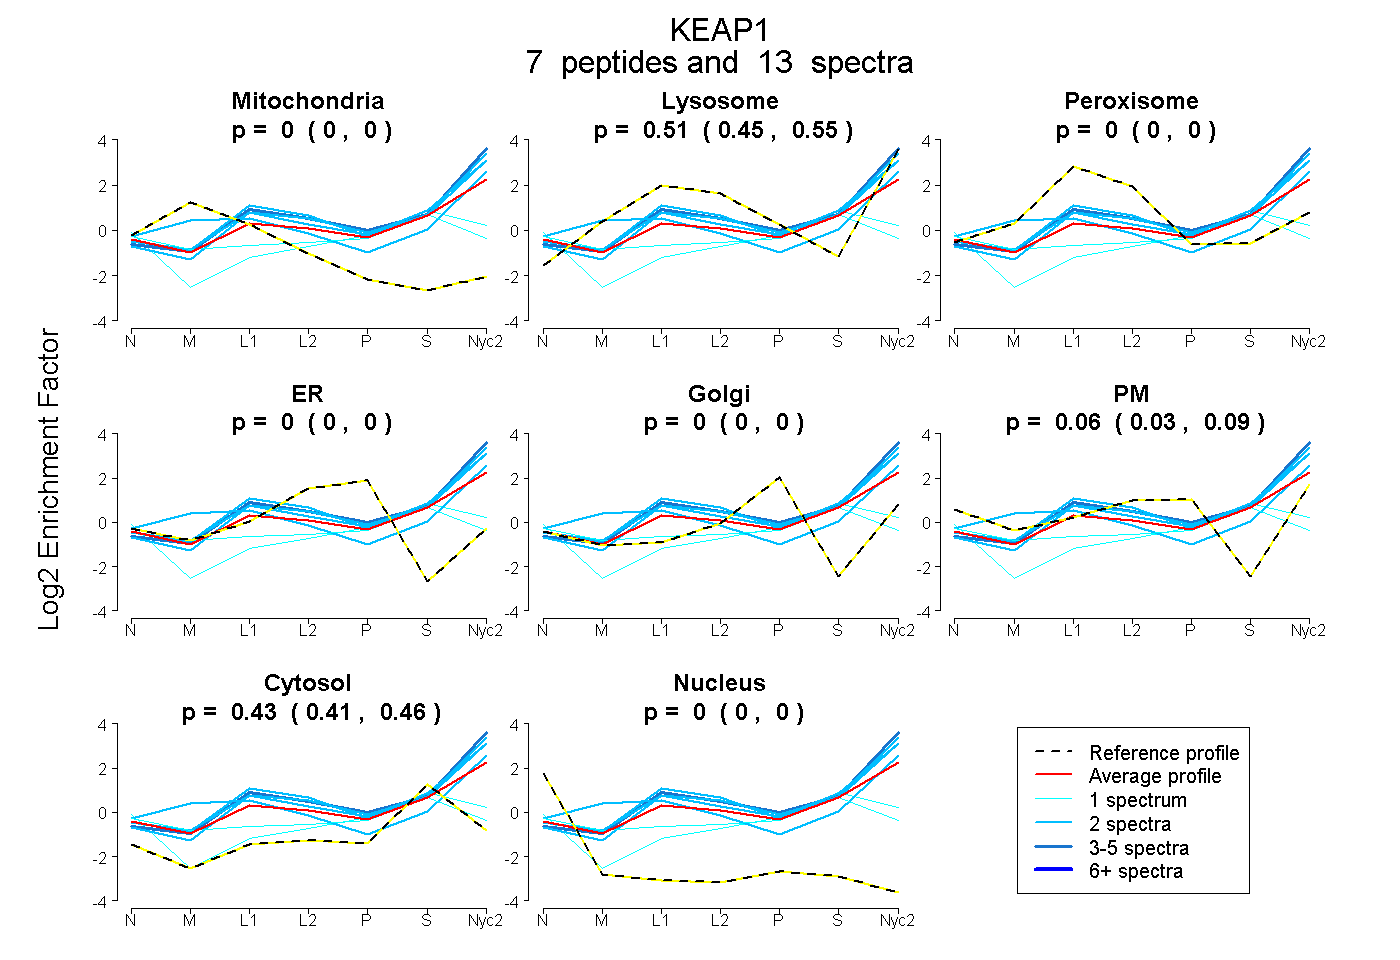
KEAP1
[ENSRNOP00000028360]

Main page
Plot Mito Lyso Perox ER Golgi PM Cytosol Nucleus
Expt A 7
peptides
13
spectra
0.000
0.000 | 0.000
0.506
0.452 | 0.546

0.000
0.000 | 0.000
0.000
0.000 | 0.000
0.000
0.000 | 0.000
0.060
0.028 | 0.087
0.434
0.409 | 0.456
0.000
0.000 | 0.000

Plot Mito Lyso or Perox ER Golgi PM Cytosol Nucleus
Expt B 1
peptide
1
spectrum
0.000
NA | NA

0.700
NA | NA

0.000
NA | NA
0.000
NA | NA
0.093
NA | NA
0.189
NA | NA
0.018
NA | NA

Plot Lyso Other
Expt C 7
peptides
17
spectra

0.100
0.000 | 1.000


0.900
0.000 | 1.000

Calculate protein distances from select experiments.
Maximum number of results     Minimum number of peptides     Minimum number of spectra    
Expt A     Expt B     Expt C