 7
7peptides
spectra
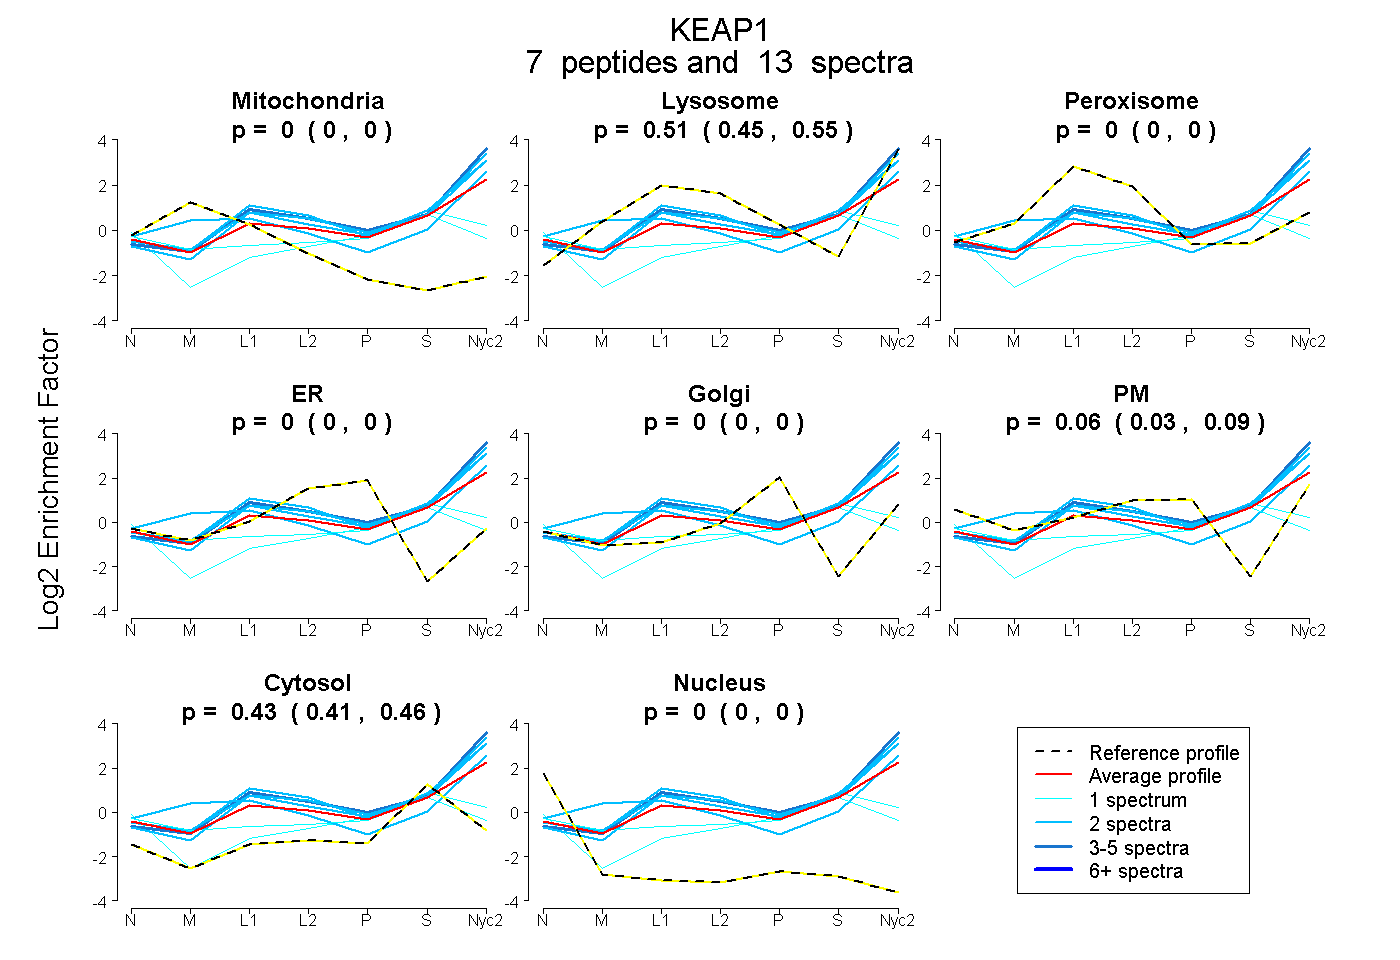
0.000 | 0.000
0.452 | 0.546
0.000 | 0.000
0.000 | 0.000
0.000 | 0.000
0.028 | 0.087
0.409 | 0.456
0.000 | 0.000
| Plot | Mito | Lyso | Perox | ER | Golgi | PM | Cytosol | Nucleus | |||||
| Expt A |
7 peptides |
13 spectra |
|
0.000 0.000 | 0.000 |
0.506 0.452 | 0.546 |
0.000 0.000 | 0.000 |
0.000 0.000 | 0.000 |
0.000 0.000 | 0.000 |
0.060 0.028 | 0.087 |
0.434 0.409 | 0.456 |
0.000 0.000 | 0.000 |
| 2 spectra, MITPMNTIR | 0.000 | 0.634 | 0.000 | 0.000 | 0.000 | 0.000 | 0.366 | 0.000 | ||
| 2 spectra, LIYTAGGYFR | 0.077 | 0.640 | 0.000 | 0.000 | 0.000 | 0.000 | 0.248 | 0.035 | ||
| 1 spectrum, QEEFFNLSHCQLATLISR | 0.068 | 0.000 | 0.114 | 0.000 | 0.000 | 0.215 | 0.603 | 0.000 | ||
| 3 spectra, IGVGVAVLNR | 0.000 | 0.723 | 0.000 | 0.000 | 0.000 | 0.000 | 0.277 | 0.000 | ||
| 1 spectrum, AEVTPSQDGNR | 0.000 | 0.000 | 0.000 | 0.000 | 0.009 | 0.257 | 0.734 | 0.000 | ||
| 2 spectra, LLYAVGGFDGTNR | 0.000 | 0.720 | 0.000 | 0.000 | 0.000 | 0.000 | 0.280 | 0.000 | ||
| 2 spectra, LADLQVPR | 0.000 | 0.680 | 0.000 | 0.000 | 0.000 | 0.000 | 0.320 | 0.000 |
| Plot | Mito | Lyso or Perox | ER | Golgi | PM | Cytosol | Nucleus | ||||||
| Expt B |
1 peptide |
1 spectrum |
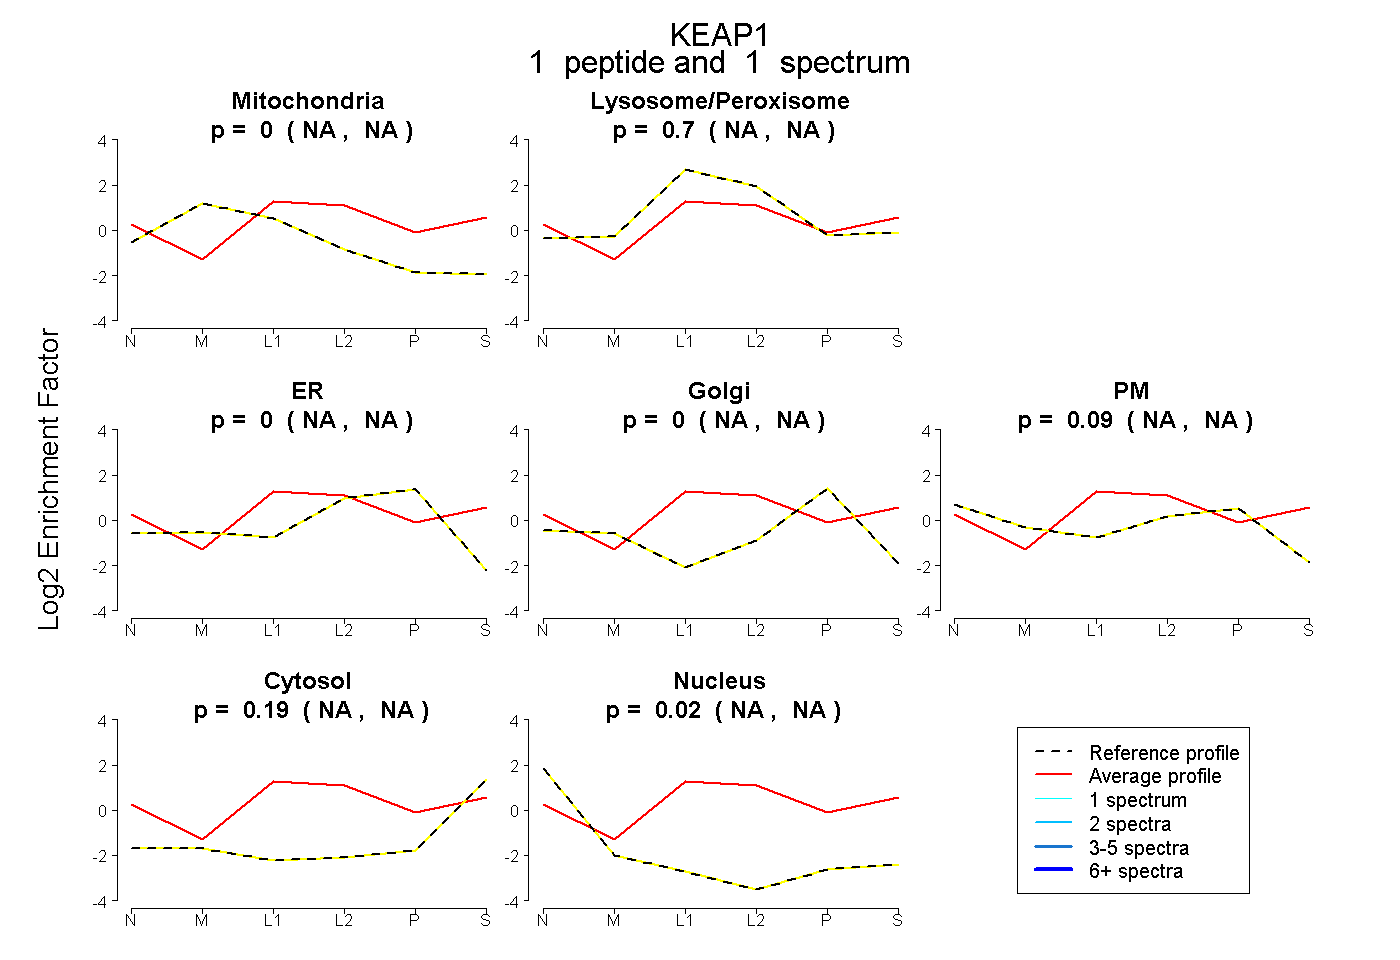 |
0.000 NA | NA |
0.700 NA | NA |
0.000 NA | NA |
0.000 NA | NA |
0.093 NA | NA |
0.189 NA | NA |
0.018 NA | NA |
|||
| Plot | Lyso | Other | |||||||||||
| Expt C |
7 peptides |
17 spectra |
 |
0.100 0.000 | 1.000 |
0.900 0.000 | 1.000 |