 8
8peptides
spectra
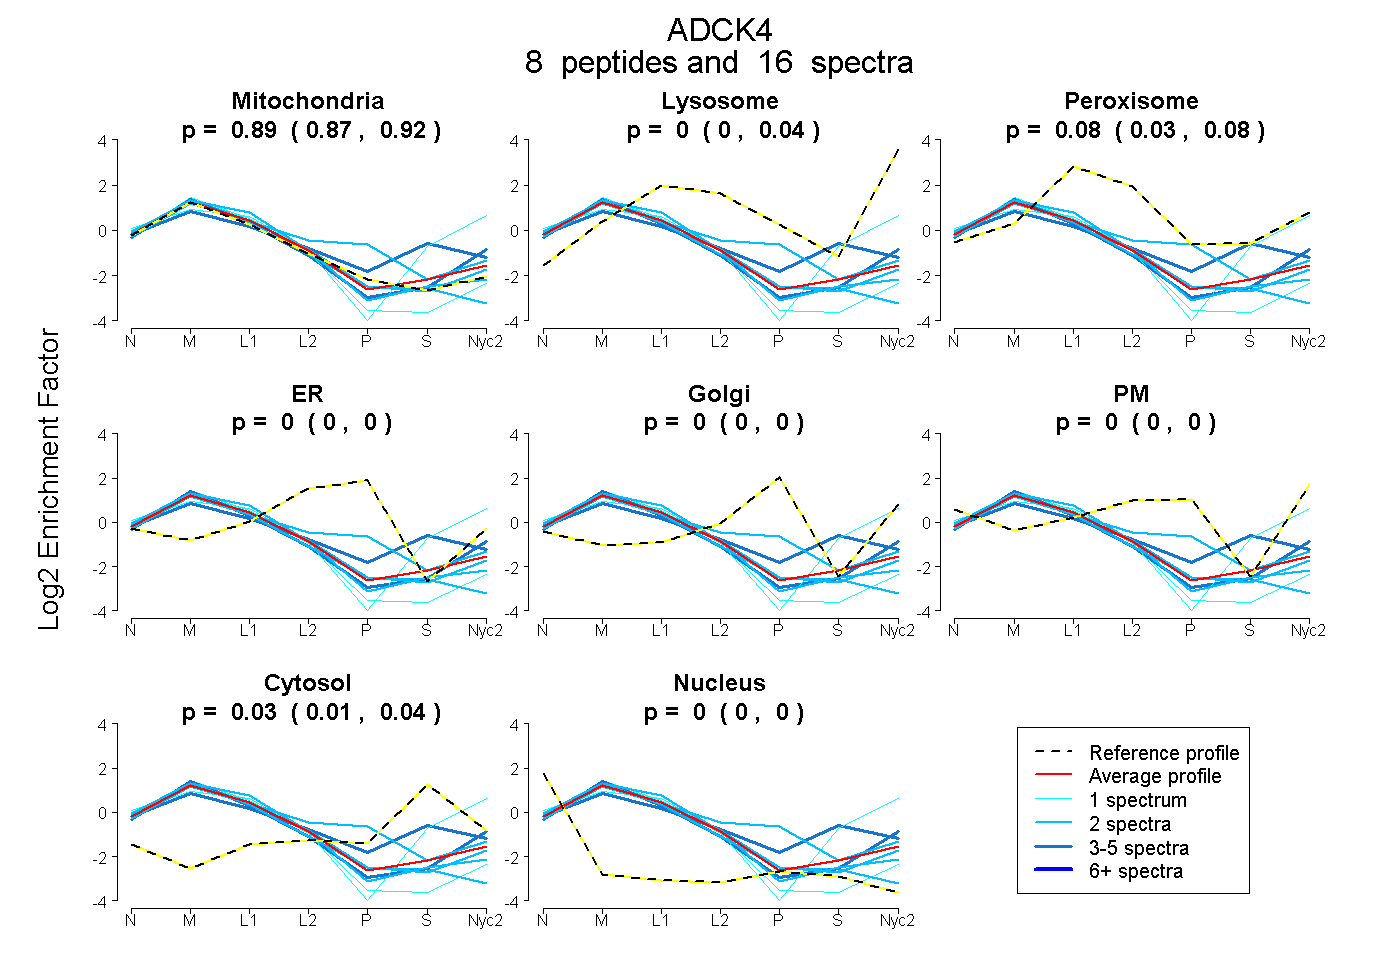
0.868 | 0.922
0.000 | 0.038
0.034 | 0.083
0.000 | 0.000
0.000 | 0.000
0.000 | 0.000
0.009 | 0.043
0.000 | 0.000
4peptides
spectra
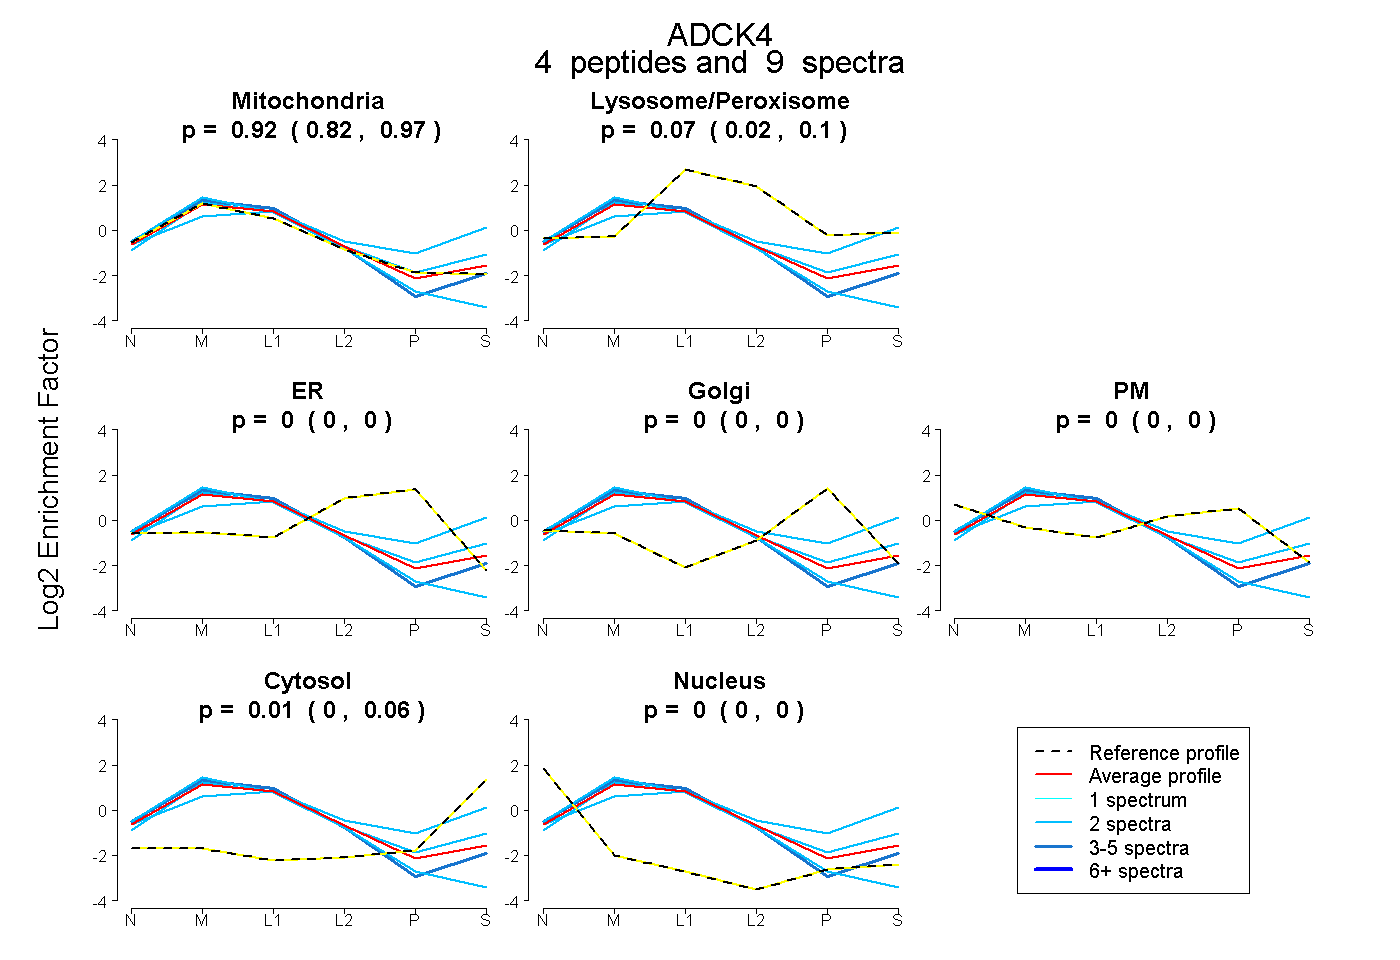
0.818 | 0.975
0.017 | 0.105
0.000 | 0.000
0.000 | 0.000
0.000 | 0.000
0.000 | 0.057
0.000 | 0.000
17peptides
spectra
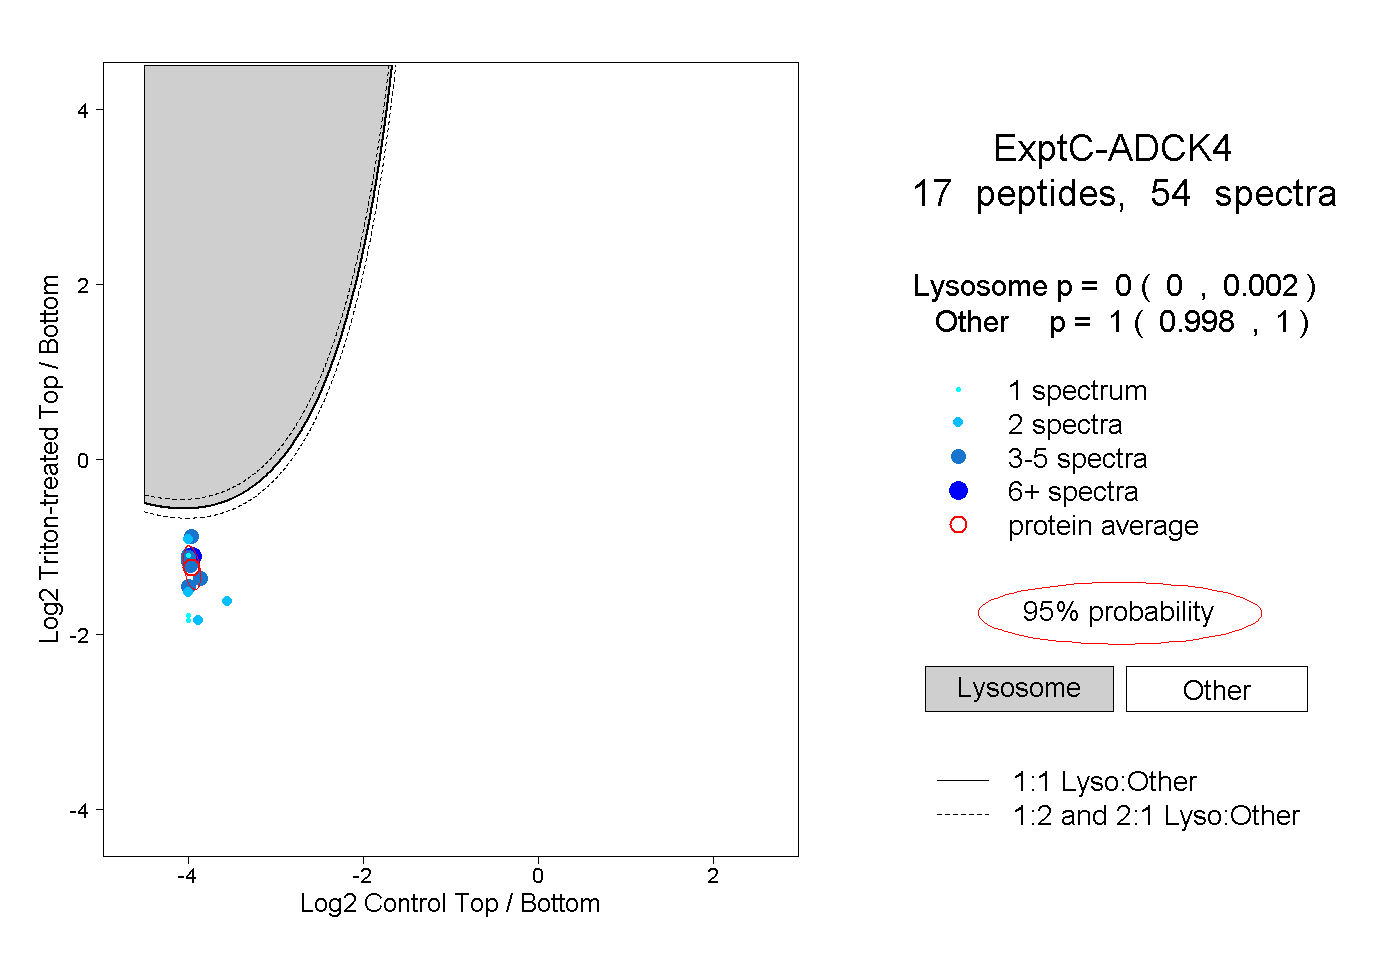
0.000 | 0.002
0.998 | 1.000
5peptides
spectra
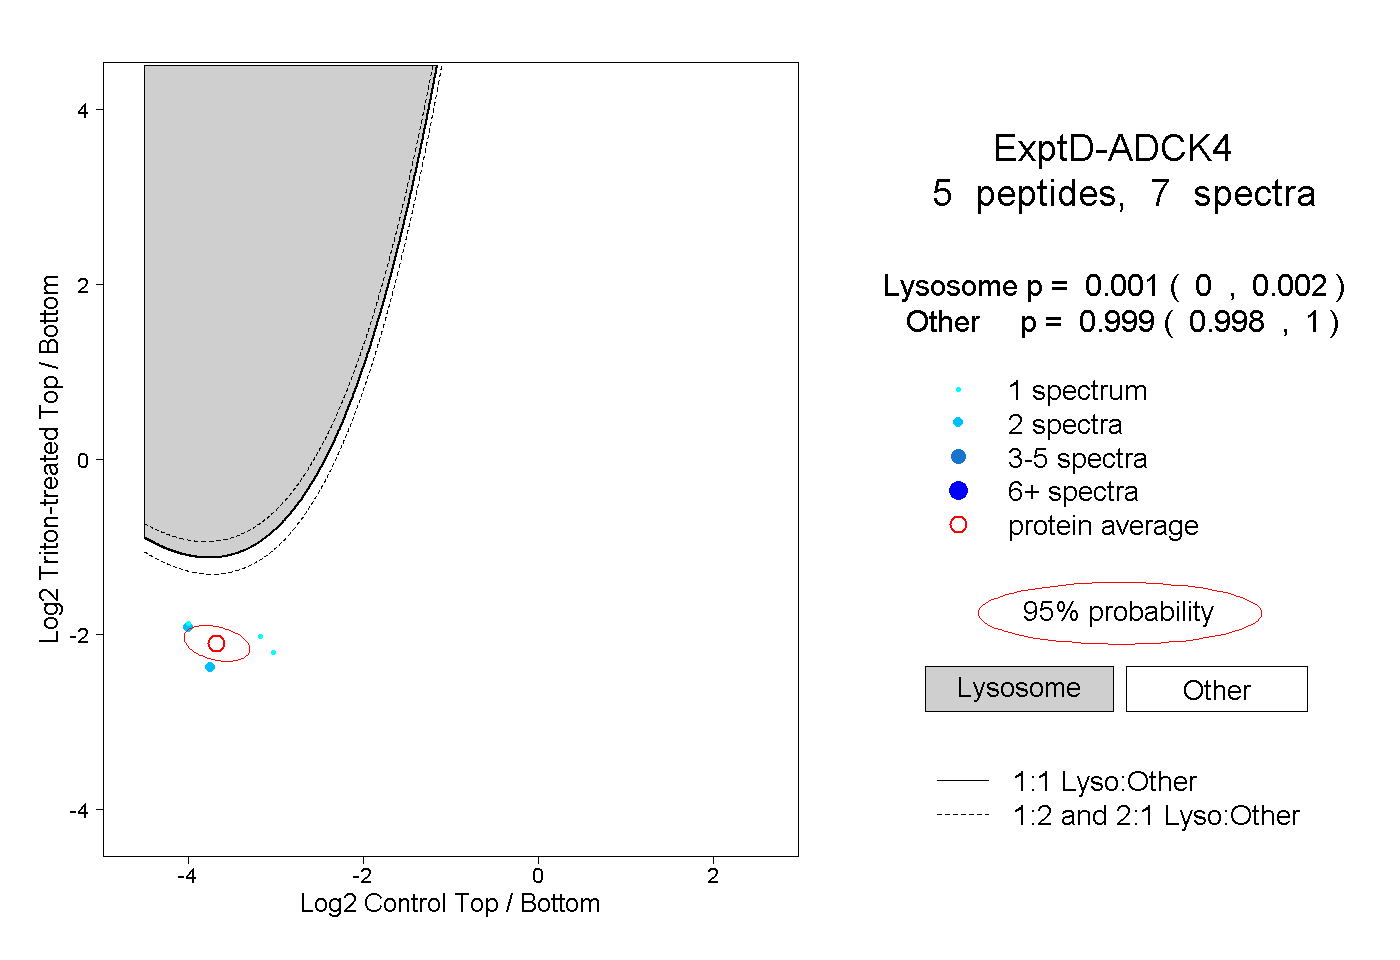
0.000 | 0.002
0.998 | 1.000