 8
8peptides
spectra
0.868 | 0.922
0.000 | 0.038
0.034 | 0.083
0.000 | 0.000
0.000 | 0.000
0.000 | 0.000
0.009 | 0.043
0.000 | 0.000
| Plot | Mito | Lyso | Perox | ER | Golgi | PM | Cytosol | Nucleus | |||||
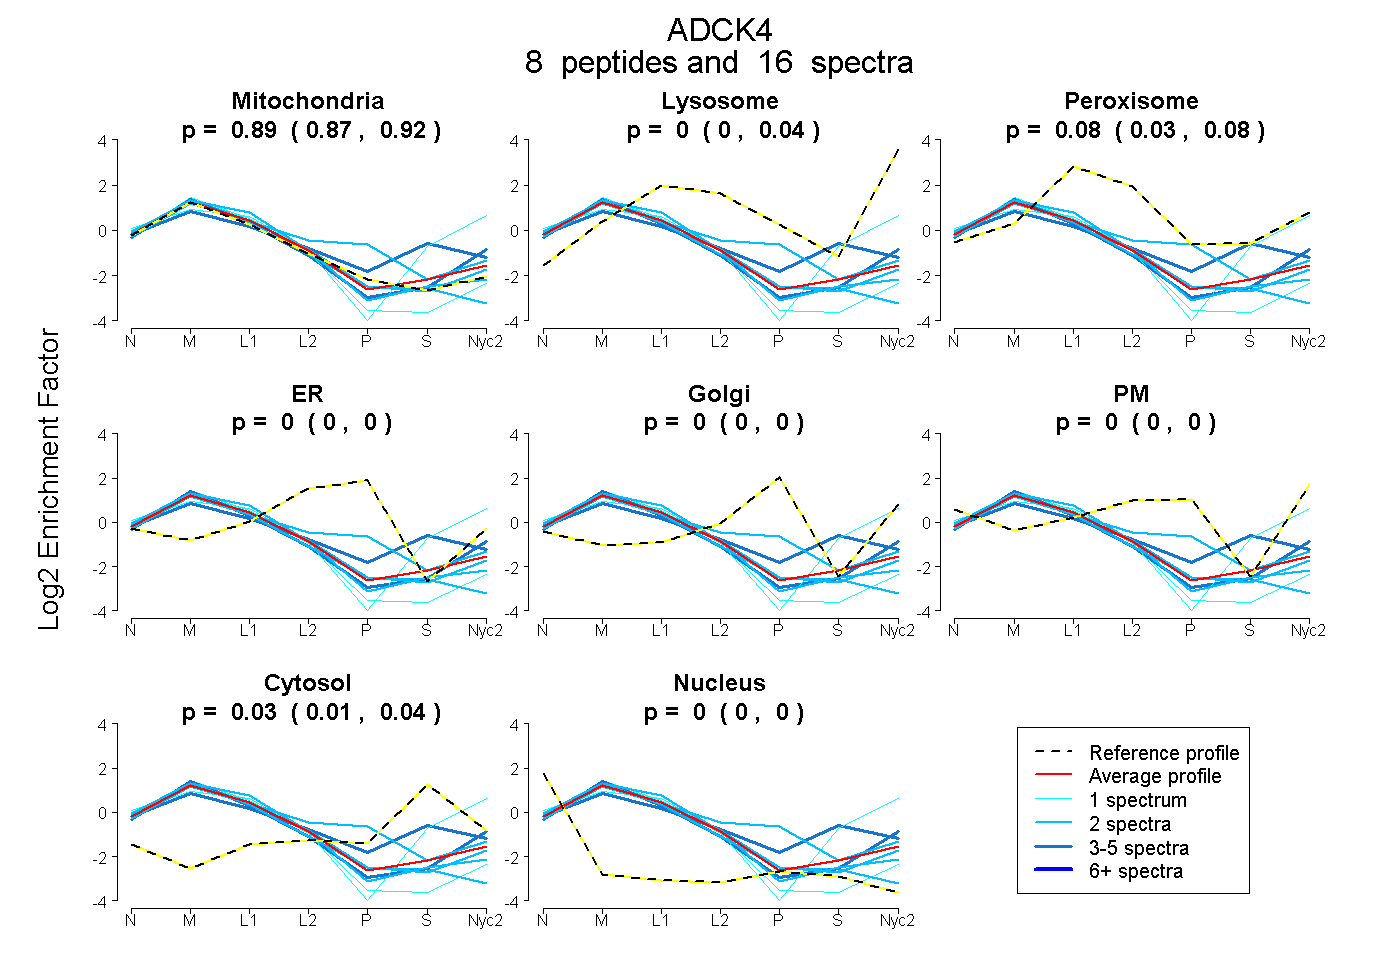
| Expt A |
8 peptides |
16 spectra |
|
0.895 0.868 | 0.922 |
0.000 0.000 | 0.038 |
0.076 0.034 | 0.083 |
0.000 0.000 | 0.000 |
0.000 0.000 | 0.000 |
0.000 0.000 | 0.000 |
0.029 0.009 | 0.043 |
0.000 0.000 | 0.000 |
| 1 spectrum, IVQTLCTVR | 1.000 | 0.000 | 0.000 | 0.000 | 0.000 | 0.000 | 0.000 | 0.000 | ||
| 2 spectra, LHAHIACR | 0.986 | 0.000 | 0.000 | 0.000 | 0.000 | 0.000 | 0.000 | 0.014 | ||
| 2 spectra, VPAVVEELCTTR | 0.993 | 0.000 | 0.007 | 0.000 | 0.000 | 0.000 | 0.000 | 0.000 | ||
| 1 spectrum, LRPPPEETYALHR | 0.599 | 0.197 | 0.035 | 0.000 | 0.000 | 0.000 | 0.169 | 0.000 | ||
| 2 spectra, VTLLDFGASR | 0.988 | 0.012 | 0.000 | 0.000 | 0.000 | 0.000 | 0.000 | 0.000 | ||
| 3 spectra, LAGAFLACAR | 0.582 | 0.000 | 0.167 | 0.000 | 0.000 | 0.000 | 0.251 | 0.000 | ||
| 3 spectra, LLADDPFFR | 0.909 | 0.091 | 0.000 | 0.000 | 0.000 | 0.000 | 0.000 | 0.000 | ||
| 2 spectra, NQICFQLLR | 0.664 | 0.000 | 0.097 | 0.105 | 0.134 | 0.000 | 0.000 | 0.000 |
| Plot | Mito | Lyso or Perox | ER | Golgi | PM | Cytosol | Nucleus | ||||||
| Expt B |
4 peptides |
9 spectra |
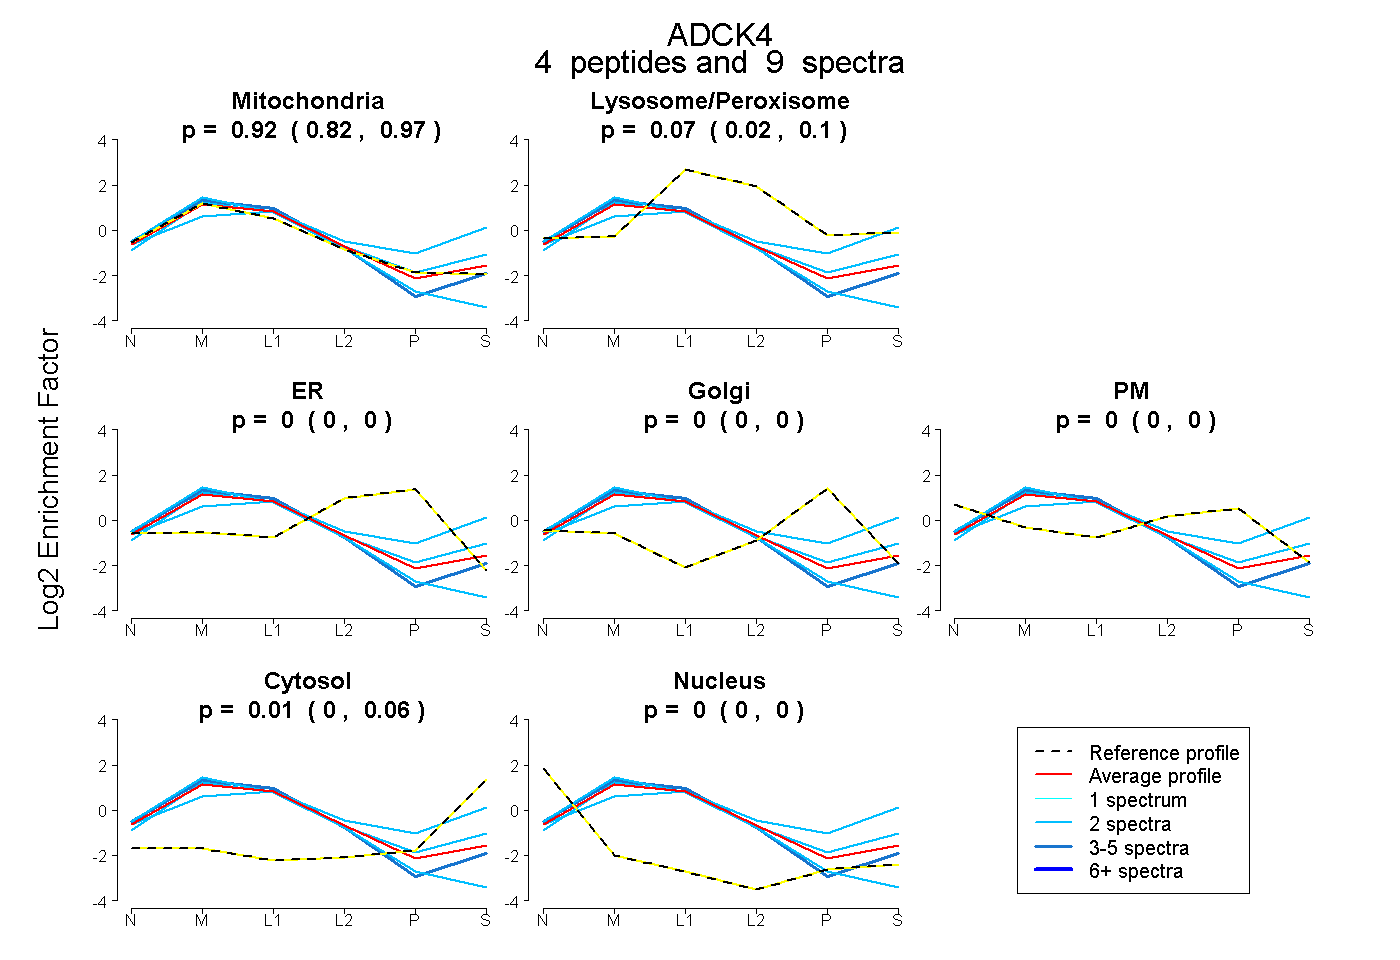 |
0.921 0.818 | 0.975 |
0.066 0.017 | 0.105 |
0.000 0.000 | 0.000 |
0.000 0.000 | 0.000 |
0.000 0.000 | 0.000 |
0.013 0.000 | 0.057 |
0.000 0.000 | 0.000 |
|||
| Plot | Lyso | Other | |||||||||||
| Expt C |
17 peptides |
54 spectra |
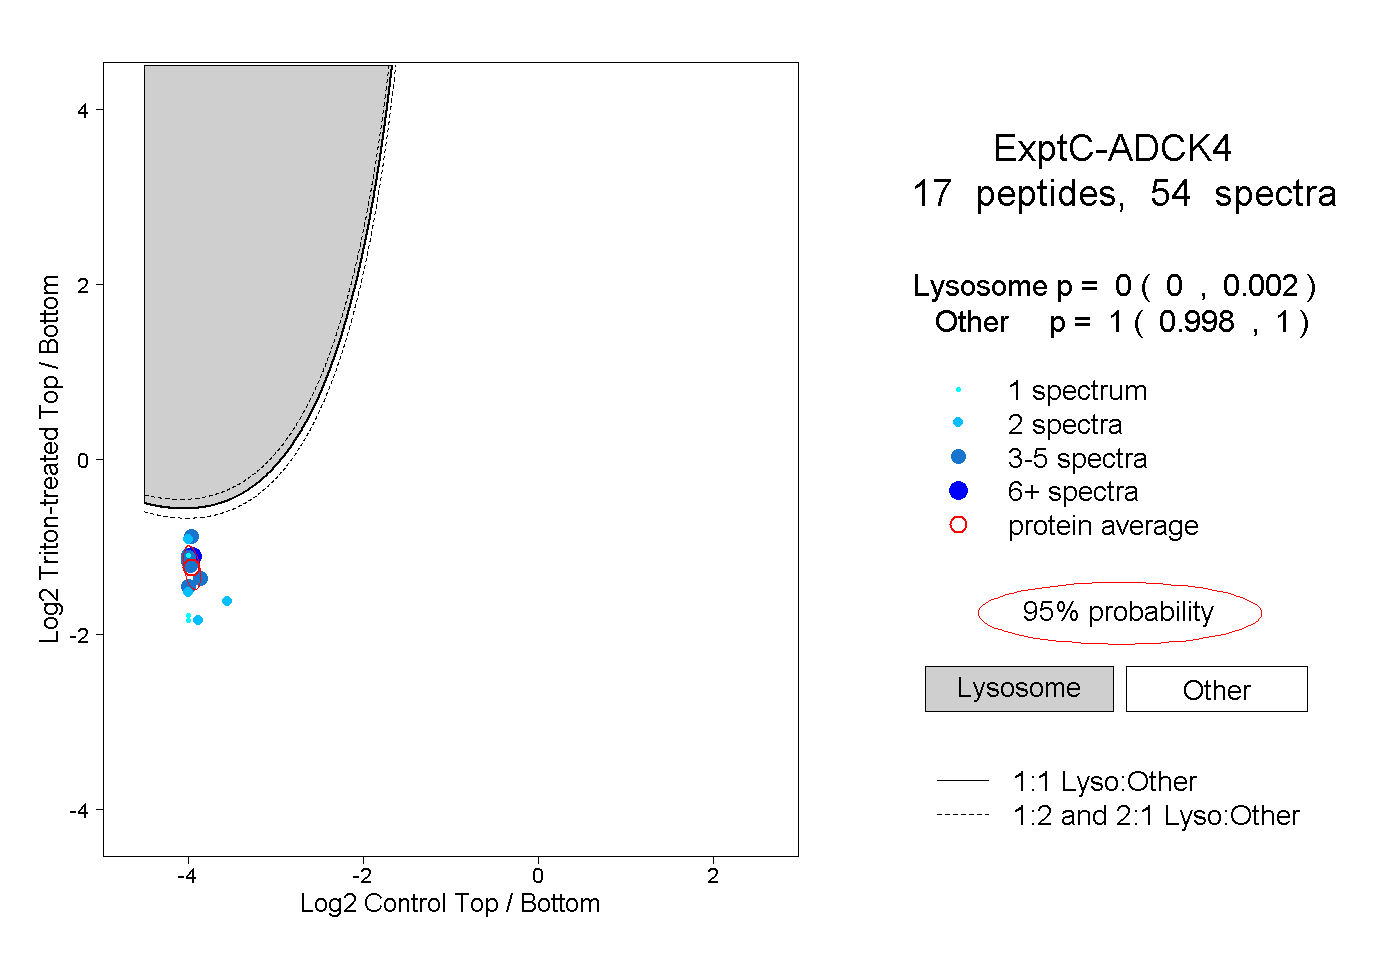 |
0.000 0.000 | 0.002 |
1.000 0.998 | 1.000 |
||||||||
| Plot | Lyso | Other | |||||||||||
| Expt D |
5 peptides |
7 spectra |
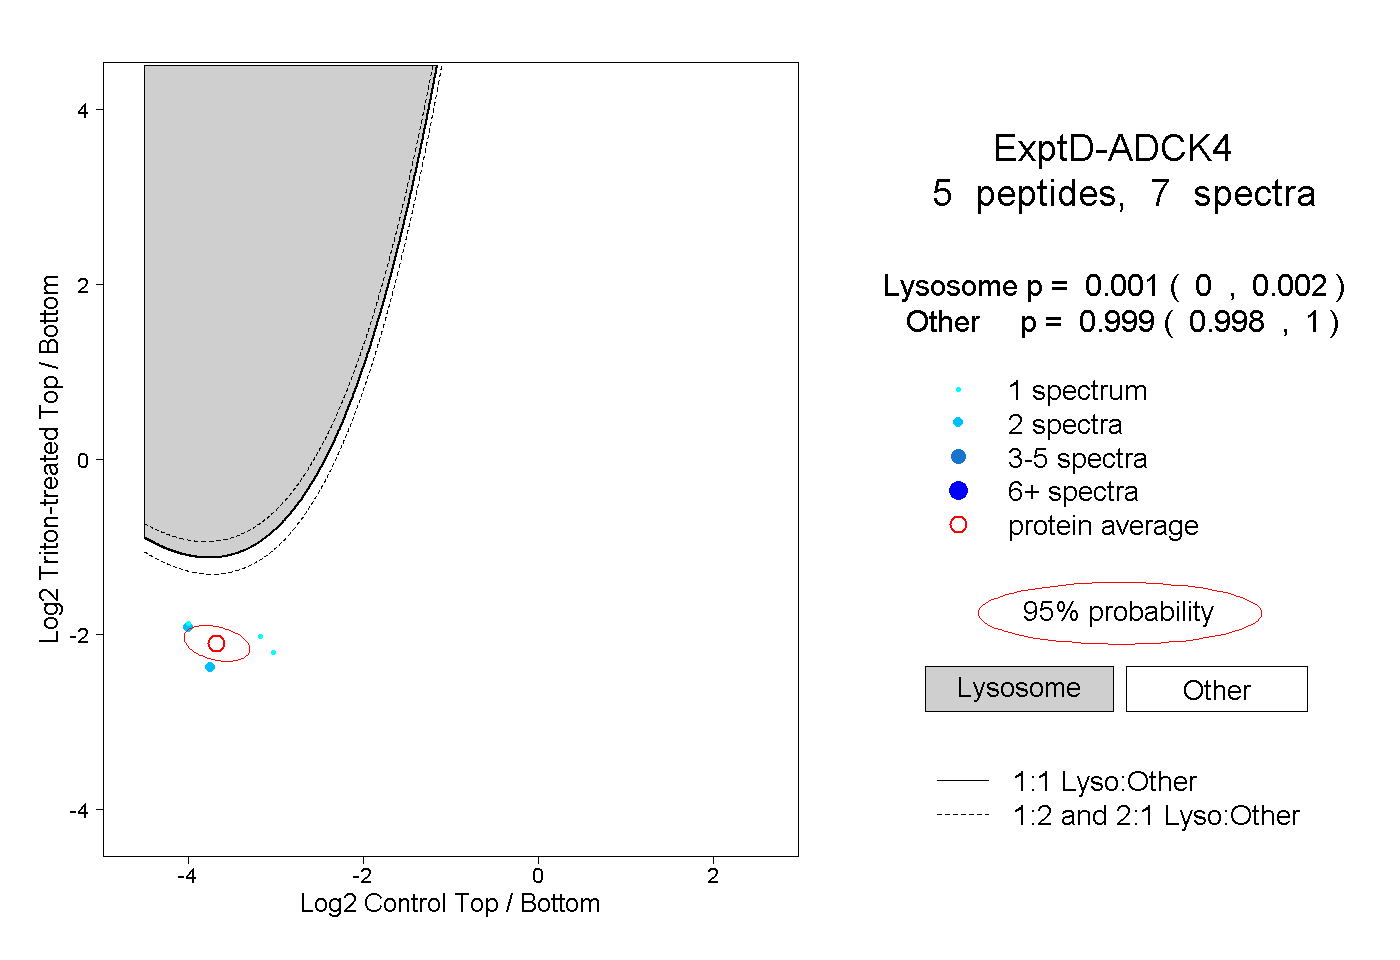 |
0.001 0.000 | 0.002 |
0.999 0.998 | 1.000 |